Best ETF Screener: 7 Tools That Filter 4,000 Funds Fast
Last updated: September 25, 2026
Quick Answer
The best ETF screener depends on what job you're actually hiring it for. Koyfin wins on free-tier depth, Stock Rover wins on fundamental digging, Barchart wins on raw filter count, and StockAnalysis.com wins on a free, clean workflow with a genuinely useful overlap tool. ETF.com alone tracks more than 4,300 funds, so the real question isn't which tool has the biggest database. It's which filters match your strategy: expense ratio, overlap, sector exposure, or dividend yield.
Key Takeaways
- Koyfin's free tier covers sector, dividend, and technical filters that a lot of paid tools still charge for.
- Stock Rover screens fundamentals across ETFs and stocks in one workflow, which matters if you're comparing a fund to its own top holdings.
- TradingView's ETF screener added multi-region select and duplicate secondary-listing removal in its September 2026 update.
- StockAnalysis.com's Fund Holdings Overlap tool launched September 23, 2026, and flags shared exposure between funds like VOO and QQQ.
- ETF.com currently screens more than 4,300 ETFs by flows, ESG traits, issuer, and holdings.
- Free ETF screeners cover most of what a self-directed investor needs before a paid upgrade earns its keep.
- Barchart carries more than 150 screener filters, according to FullStack Alpha's own testing of the platform.
What Is the Best ETF Screener for Your Strategy?
The best ETF screener is the one that matches the filter you actually need, not the one with the longest feature list on its landing page. A casual investor comparing three dividend funds needs something different than a sector rotation trader flipping exposure every few weeks.
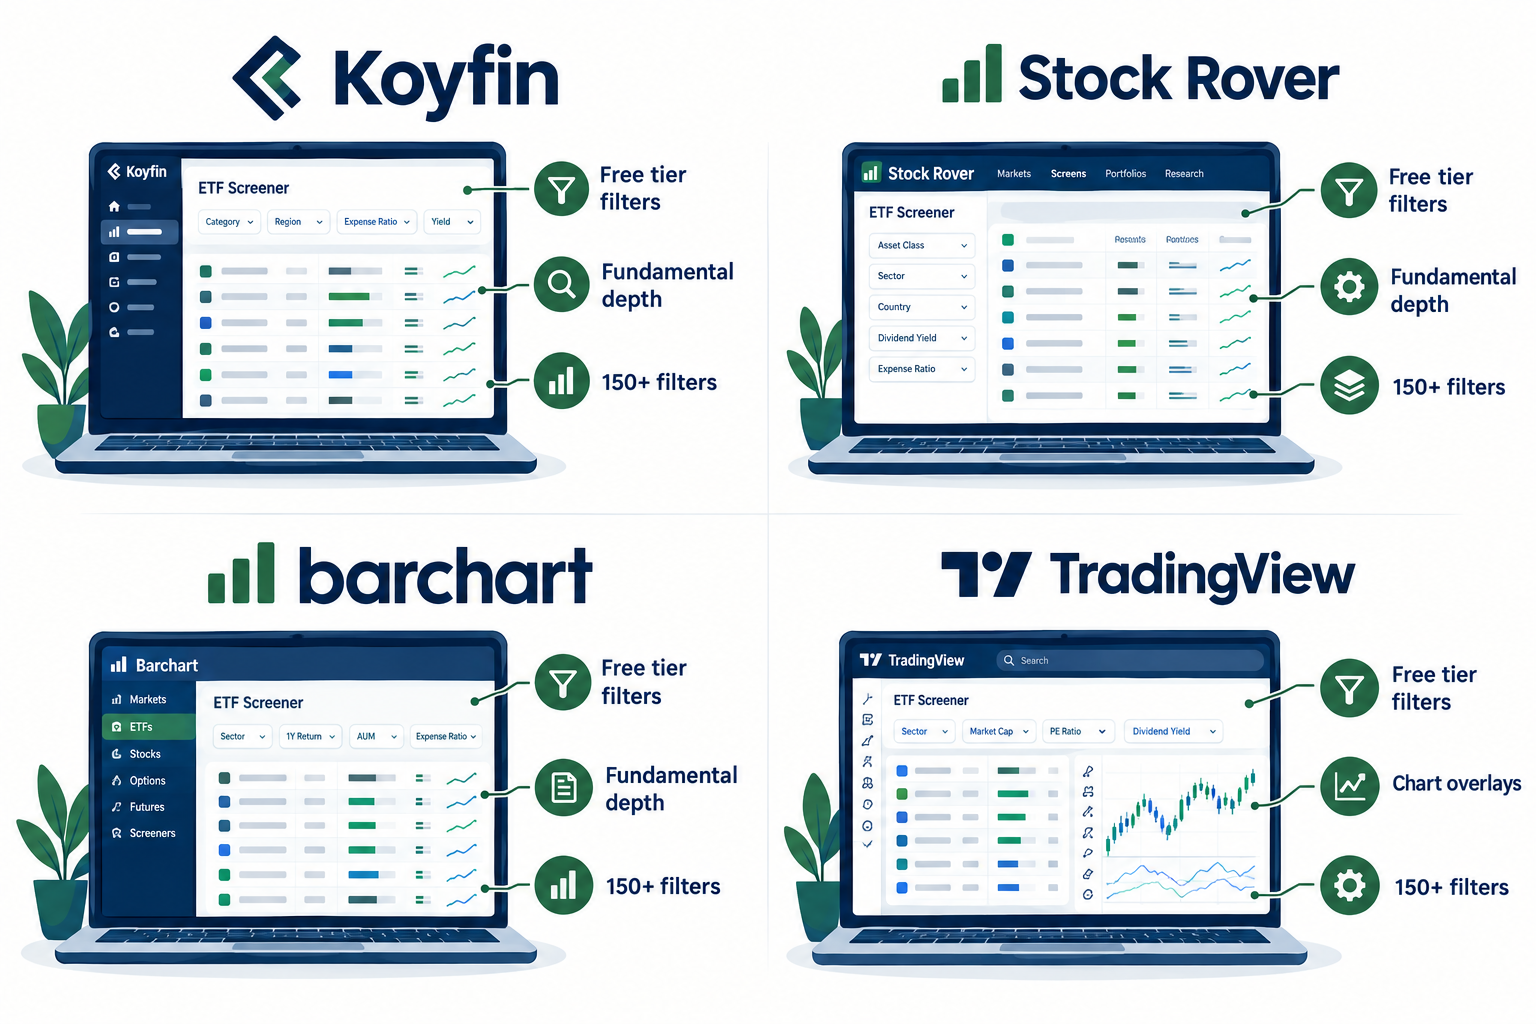
Here's how the choice breaks down by job:
- Free casual research: Koyfin or StockAnalysis.com
- Fundamental deep dives: Stock Rover
- Widest possible filter net: Barchart
- Visual, at-a-glance scoring: Simply Wall St
- Valuation of what's actually inside the fund: FAST Graphs
- Chart-first, technical screening: TradingView
An ETF screener works by pulling a database of fund data, holdings, expense ratios, fund flows, performance, and sometimes technical indicators, then letting you set thresholds and sort the results. Set "expense ratio under 0.20%" and "AUM over $1 billion," hit filter, and the tool returns every ETF that clears both bars. That's it. No spreadsheet, no manually cross-referencing prospectuses.
Decision rule: if you're new to ETF investing, start free. If you're actively rotating between sectors or comparing overlapping funds every week, the paid tier on Stock Rover or Barchart starts to pay for itself in time saved.
The 7 Best ETF Screeners, Ranked and Tested for 2026
This ranking is built on actual screen time, not marketing copy. Each entry covers the filters that matter, current pricing (confirm exact numbers on the vendor's own pricing page before you subscribe), and who it actually fits.
1. Koyfin: free tier depth
Filters: sector and industry exposure, dividend yield, expense ratio, technical indicators, fund flows, holdings breakdown.
Price: free plan available; paid Plus and Pro tiers open up deeper history and export limits (check Koyfin's own pricing page for current figures).
Best for: the investor who wants a serious ETF screener without opening a wallet first. Koyfin built its reputation on giving away data that competitors gate behind a paywall, and its ETF screening still reflects that. It's also a solid entry point if you're testing whether an AI ETF screener workflow even fits how you research funds before paying for anything.
2. Stock Rover: fundamental depth
Filters: expense ratio, dividend growth, holdings overlap, sector weighting, risk metrics, and side-by-side fundamental comparison across both ETFs and the stocks inside them.
Price: free trial, then tiered paid plans (Essentials, Premium, Premium Plus). Exact current pricing lives on Stock Rover's own site.
Best for: investors who want an ETF comparison tool that doubles as a stock research platform. If you want to know whether a dividend ETF's yield is backed by real earnings growth in its top ten holdings, Stock Rover is built for that question specifically.
3. Barchart: data breadth
Filters: more than 150 screener filters spanning performance, technicals, options-implied volatility on the underlying, dividend metrics, and fund classification, per FullStack Alpha's own Barchart deep dive.
Price: free tier with limited data; paid Premier plans scale by data depth (Barchart lists current tiers on its site).
Best for: power users who'd rather have too many filters than too few. Barchart is the closest thing on this list to a Bloomberg terminal for retail budgets, and it shows in how many ways you can slice a fund list.
4. Simply Wall St: visual analysis
Filters: a visual "snowflake" score covering value, future outlook, past performance, financial health, and dividend strength, applied to the fund's underlying holdings.
Price: free tier with limited coverage; a paid Premium plan opens up full analysis (check Simply Wall St's pricing page for the current number).
Best for: visual thinkers who'd rather glance at a shape than scroll a spreadsheet. It's less of a raw ETF screener and more of a fast-read layer on top of one, which makes it a good second opinion tool rather than a first stop.
5. FAST Graphs: valuation lens
FAST Graphs isn't really an ETF screener in the traditional sense. It doesn't screen ETFs directly. It screens the holdings inside them, plotting price against earnings and dividend history for individual stocks.
Filters: valuation vs. earnings, dividend growth history, price-to-normal-P/E overlays, applied stock by stock.
Price: subscription-based; FAST Graphs publishes current plan pricing on its own site.
Best for: ETF investors who want to check whether a fund's top five holdings are cheap, expensive, or fairly valued before they add to a position. Pair it with a real ETF screener, don't replace one with it.
6. TradingView: chart-first screening
Filters: NAV, region, management style, dividends, fund flows, holdings, risk, and a full technical suite including RSI, Stochastic RSI, momentum, moving averages, Keltner Channels, and beta.
Price: free tier with ads and delayed data; paid Essential, Plus, and Premium plans remove limits (TradingView lists exact monthly figures on its pricing page).
Best for: chart-first traders who want their ETF screener and their charting platform to live in the same tab. TradingView expanded this workflow in September 2026, adding multi-region selection, saved screens, CSV export, and automatic removal of duplicate secondary listings, which matters if you're comparing a U.S.-listed ETF against its European twin without double-counting results.
7. StockAnalysis.com: free and clean
Filters: expense ratio, AUM, dividend yield, one, three, and five-year Sharpe and Sortino ratios, and fund holdings overlap.
Price: free, with an optional Pro tier for extended history (pricing listed on the site).
Best for: anyone who wants a genuinely free ETF screener that doesn't feel like a stripped-down demo. StockAnalysis.com launched a Fund Holdings Overlap tool on September 23, 2026, that compares ETFs or mutual funds by shared holdings, sector concentration, and combined portfolio exposure, catching things like unintentional overlap between VOO and QQQ before you buy both and call it diversification. It also added three- and five-year Sharpe and Sortino ratios on August 16, 2026, while keeping one-year ratios as the default view. Yahoo Finance runs a similar free ETF screening tool worth a look if you already live inside Yahoo's research hub.
ETF Screener Comparison at a Glance
| Screener | Starting Price | Free Tier | ETF-Specific Filters | Exports |
|---|---|---|---|---|
| Koyfin | Free, paid tiers available | Yes | Sector, dividend, technicals | Limited on free plan |
| Stock Rover | Free trial, then paid | Trial only | Fundamentals, overlap, risk | Yes on paid tiers |
| Barchart | Free, Premier tiers scale up | Yes | 150+ filters across performance and dividends | Yes on paid tiers |
| Simply Wall St | Free, paid Premium | Yes | Visual scoring on holdings | Limited |
| FAST Graphs | Paid subscription | No free full access | Valuation on underlying stocks | Yes |
| TradingView | Free, paid tiers scale up | Yes | NAV, region, flows, technicals | Yes, CSV export |
| StockAnalysis.com | Free, Pro tier optional | Yes | Overlap, Sharpe/Sortino, expense ratio | Yes |
ETF Screener vs Stock Screener: What Actually Changes
An ETF screener filters funds by fund-level data like expense ratio, AUM, and fund flows. A stock screener filters individual companies by earnings, revenue growth, and price action. They're built for different questions, and mixing them up wastes time.
A stock screener like Finviz answers "which companies just broke out on volume?" An ETF screener answers "which fund gives me diversified exposure to that same theme without picking a single stock?" FullStack Alpha's own comparison of Finviz's screener filters against Barchart Elite covers this stock-side workflow directly.
Common mistake: running fund tickers through a stock screener that wasn't built to read fund-level fields like expense ratio or NAV. You'll get blank or misleading data because the tool isn't reading the right database. If you're deciding between filtering individual names or entire funds, FullStack Alpha's breakdown of stock screener vs scanner mechanics explains the underlying difference in plain terms.
Which ETF Screener Filters Matter Most?
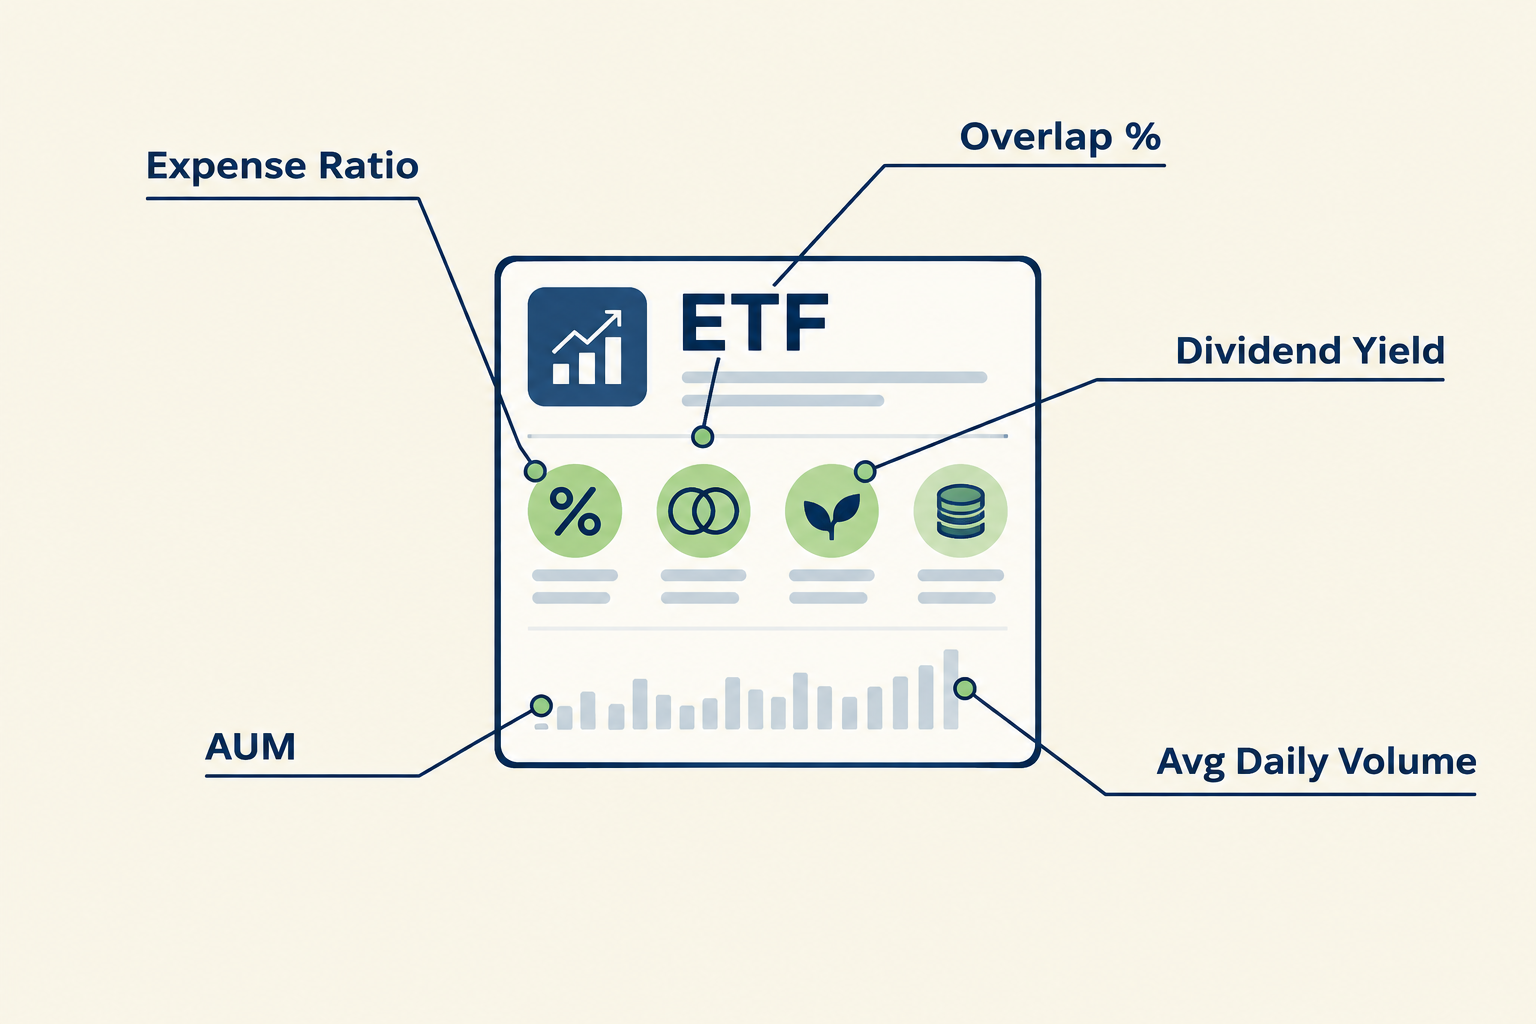
Five filters do most of the real work: expense ratio, overlap, dividend yield, AUM, and liquidity. Everything else is a nice-to-have layered on top.
- Expense ratio: the annual fee taken out of your return, expressed as a percentage. An expense ratio screener set to "under 0.10%" instantly cuts a 4,300-fund list down to the cheap, boring index funds that tend to survive decade after decade.
- Overlap: how much two ETFs share the same underlying stocks. An etf overlap tool catches the trap of thinking you're diversified when two of your "different" funds are 60% the same ten stocks.
- Dividend yield and growth: a dividend ETF screener sorts funds by current yield, but also by dividend growth streak, which matters more than the headline number if you're building income for the long haul.
- AUM (assets under management): low AUM can mean higher spreads and closure risk. Most screeners let you set a floor, commonly $500 million to $1 billion, as a basic quality filter.
- Liquidity: average daily volume and bid-ask spread. A cheap fund nobody trades can still cost you on the entry and exit if the spread is wide.
Decision rule: if you can only set three filters, use expense ratio, AUM, and overlap. Those three alone eliminate most of the bad picks before you even look at performance charts.
How Do You Screen ETFs for Sector Rotation?
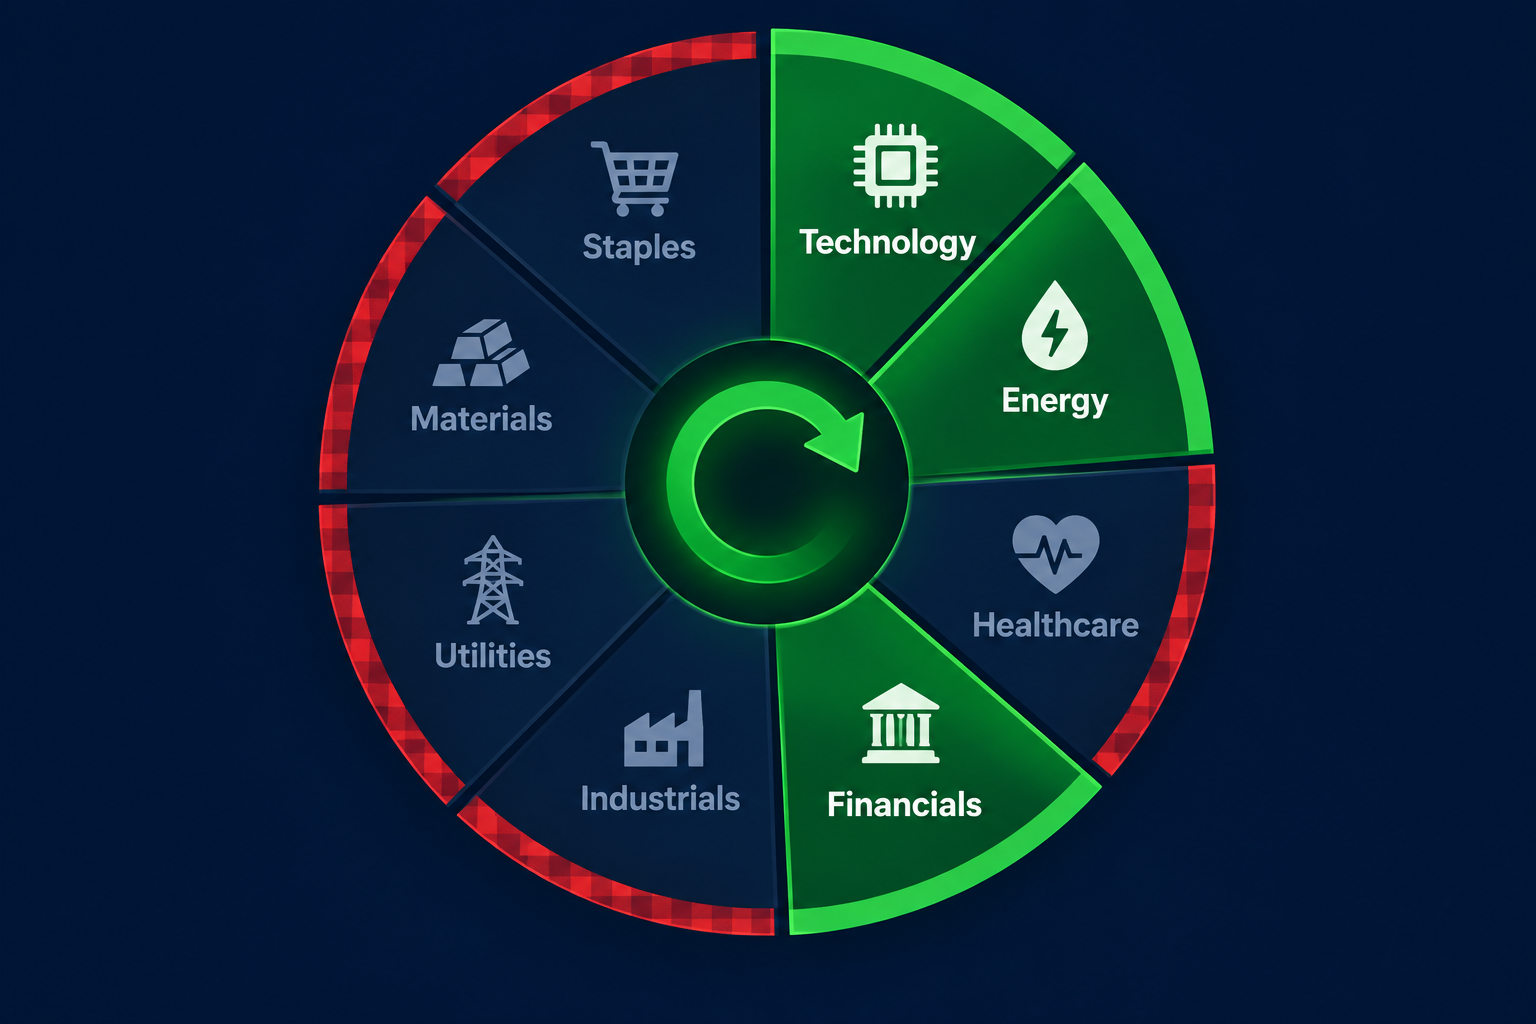
Screening ETFs for sector rotation means filtering by sector classification, relative strength, and fund flows to find where money is moving before the move is obvious to everyone reading the same headlines.
The setup for a sector rotation ETF screener usually looks like this:
- Filter by sector classification (technology, energy, financials, and so on) to build your universe.
- Sort by relative strength or momentum over a defined window, often 1, 3, and 6 months.
- Cross-check fund flows. Rising price with rising inflows is a stronger signal than a price pop on thin volume.
- Confirm with price action. A clean setup on the chart, ideally basing after a tight consolidation rather than already overextended, matters more than the sector label alone.
- Set a stop loss and position size before entry. Sector ETFs move as a basket, but a bad entry still hurts the same way.
TradingView's technical filter set, including RSI, momentum, and moving averages layered on top of fund flow data, is built for exactly this kind of screen. Barchart's dividend and performance filters work too if you're rotating on a slower, weeks-not-days timeframe.
One honest warning here: chasing a sector after it's already up 15% because everyone's talking about it is FOMO, not a setup. Screen for the move before it's obvious, not after.
Best ETF Screener Picks for Passive, Factor, and International Investing
The best ETF screener for a passive investor is different from the best one for a factor tilt or an international allocation, because each strategy leans on different fields.
- Passive investing: StockAnalysis.com or Koyfin. You're mostly filtering by expense ratio, AUM, and tracking a broad index, so a free etf screener free of clutter beats a feature-heavy paid tool.
- Factor investing: Stock Rover. Screening for value, quality, or momentum tilts inside a fund requires the fundamental depth that a pure fund-flow screener doesn't have.
- International funds: TradingView. Its multi-region select and duplicate secondary-listing removal, added in the September 2026 update, solve the specific headache of comparing a U.S.-listed international ETF against its foreign-listed twin without double-counting the same underlying fund.
Edge case: newer, structurally unusual ETFs (leveraged, buffered, or actively managed single-stock funds) sometimes don't fit standard screener fields cleanly. Read the actual prospectus for anything that doesn't look like a plain index fund before trusting a filter result at face value.
How to Use an ETF Screener If You're Starting From Zero
Using an ETF screener for the first time means picking two or three filters that match your goal, running the screen, and reading the results against the fund's actual holdings before buying anything.
Here's a beginner-safe sequence:
- Pick your goal first. Income, growth, sector exposure, or broad diversification. Don't screen without one.
- Set expense ratio and AUM floors. This cuts out most of the noise immediately.
- Add one strategy filter. Dividend yield for income, sector for a tilt, nothing more on your first pass.
- Check overlap against what you already own. This is the step almost everyone skips.
- Read the top ten holdings before buying. A screener result is a shortlist, not a final answer.
Common mistakes to avoid:
- Screening on yield alone and missing that the fund is shrinking its dividend, not growing it.
- Ignoring overlap and ending up with five "different" ETFs that are secretly the same 50 stocks.
- Chasing a screener result that just had a hot month, then getting stopped out when the theme cools off.
- Paying for a premium ETF screener before confirming the free tier can't already do the job.
Investopedia's broker comparison work is worth a look too, since several brokers now build basic ETF screening directly into the trading platform you're already using.
Are Free ETF Screeners Enough? (Pricing Comparison Inside)
Yes, for most self-directed investors, a free ETF screener covers the job. Koyfin, StockAnalysis.com, and Barchart's free tier between them handle expense ratio, AUM, sector, dividend yield, and overlap without a subscription.
Where a paid tier starts to earn its cost:
- Full historical data beyond one or three years.
- Unlimited exports for building your own tracking sheet.
- Deeper fundamental screens across both the ETF and its underlying holdings, which is Stock Rover's whole pitch.
- Real-time data instead of delayed quotes, which matters more for active sector rotation than long-term holding.
A recent roundup of free ETF screener free tools found the same pattern: most casual investors never hit the ceiling on the free tier before their strategy changes enough to need something more. That tracks with what we've seen testing these tools directly.
Decision rule: start free. Upgrade only when you can name the specific field a free tool doesn't give you, not because a paid dashboard just looks more serious.
ETF Screener vs Manually Researching Funds: Should You Skip the Spreadsheet?
An ETF screener beats a manual spreadsheet on speed and consistency, but it doesn't replace reading a fund's actual holdings before you buy it. The screener narrows 4,300 funds to 20. You still have to read the 20.
Manual research still wins in a few narrow cases:
- Newer, structurally unusual funds the SEC continues to review closely as fund sponsors launch more novel strategies, including recent actively managed and endowment-style launches from major issuers.
- Cross-checking a screener's classification. Screeners sometimes miscategorize a fund's true style, so a five-minute prospectus check catches what an automated field misses.
For everything else, an ETF screener is the faster path to the same conclusion a spreadsheet would eventually reach, minus the hours.
Verdict: The Best ETF Screener by Investor Type
There's no single best ETF screener, there's a best fit per job. Here's the short version:
- New investor, zero budget: StockAnalysis.com or Koyfin.
- Fundamental researcher: Stock Rover.
- Filter-hungry power user: Barchart.
- Chart-first, sector-rotation trader: TradingView.
- Visual, at-a-glance thinker: Simply Wall St, paired with a real screener.
- Valuation check on what's inside a fund: FAST Graphs, as a companion tool, not a standalone screener.
Pick one filter that matters most to you right now, expense ratio, overlap, or dividend growth, and run a screen today before adding anything to a watchlist. Data over noise, always.
Seven ETF screeners tested here. There are 200+ more AI stock tools catalogued in the FullStack Alpha directory, filterable by category and price.
Browse the directory → aistockpickerapps.com
FullStack Alpha may earn a commission from some links on this page. Rankings are based on independent testing, not payment.
References
Etf Screener - https://www.etf.com/etfanalytics/etf-screener
The Best Brokers For Etfs 8763336 - https://www.investopedia.com/the-best-brokers-for-etfs-8763336
43000718743 Tradingview Etf Screener Your Shortcut To Top Funds - https://www.tradingview.com/support/solutions/43000718743-tradingview-etf-screener-your-shortcut-to-top-funds/
Changelog - https://stockanalysis.com/changelog/
Best Etf Screener Free Tools - https://alphagaindaily.com/en/blog/best-etf-screener-free-tools
Screener - https://finviz.com/screener
finance.yahoo - https://finance.yahoo.com/research-hub/screener/etf/
Etf News You Missed This Week August 31 September 4 2026 - https://www.etfcentral.com/news/etf-news-you-missed-this-week-august-31-september-4-2026
We test the tools. You get the verdict.
One email a week. What we tested, what scored, and what we'd skip. Written for traders, not for clicks.
Frequently asked
More from FullStack Alpha