Market Chameleon After Hours: Read the Moves Before the Open
Reviewed by Jay Rocco, Chief Editor
After-Hours Movers Lie. These 3 Numbers Tell the Truth.
Read the transcript
A stock is up thirty percent after the bell. Your heart rate is up thirty percent too. Before you do anything, ask one question... how many shares actually traded? This is FullStack Alpha, and in about two and a half minutes you'll learn to read Market Chameleon's after-hours data like a pro, not a doom-scroller.
Quick answer. Market Chameleon's free after-hours movers report, delayed fifteen minutes, splits post-market trading into gainers, decliners and the most active names, with after-hours volume attached. A separate screener adds session analytics, and the paid Premium tier adds twenty days of VWAP history plus downloadable minute-by-minute files.
The most important things you need to know. Three numbers to check first, and two habits that make them useful.
One. After-hours volume. A thirty percent move on four thousand shares is one person's limit order, not a signal.
Two. Relative volume. Market Chameleon defines it as current after-hours volume divided by the twenty-day average after-hours volume. A reading of ten or more means a crowd showed up, not a straggler.
Three. Distance from VWAP, the volume-weighted average price. When price fades under after-hours VWAP, late sellers are winning.
Four. Read them in that order. Percentage change is the headline. Volume, relative volume and VWAP are the story.
Five. Keep a short evening routine. Fifteen minutes, a handful of names, and a watchlist for tomorrow, instead of an evening of staring at red and green.
What to watch out for. The free report is delayed fifteen minutes, so it's for planning, not chasing. After-hours trading is thin, so spreads run wide and prices can snap back hard by the open. And a dramatic percentage on a movers list can be pure noise. Two stocks can both look explosive, and only one has the volume behind it to mean anything.
The verdict. Market Chameleon after hours isn't a trigger. It's a filter. It tells you which overnight moves deserve a spot on tomorrow's watchlist... and which ones deserve a shrug.
Your next step. Tonight, open the after-hours movers report, pick the three names with the highest relative volume, note where each one sits against VWAP, and watch how they open tomorrow. Do that for a week and you'll trust the numbers more than the headlines.
The full walkthrough, including the fifteen-minute evening routine, is right below this player. This is education, not financial advice. Your market edge starts with the right tool. Stay alpha.
Last updated: October 28, 2026
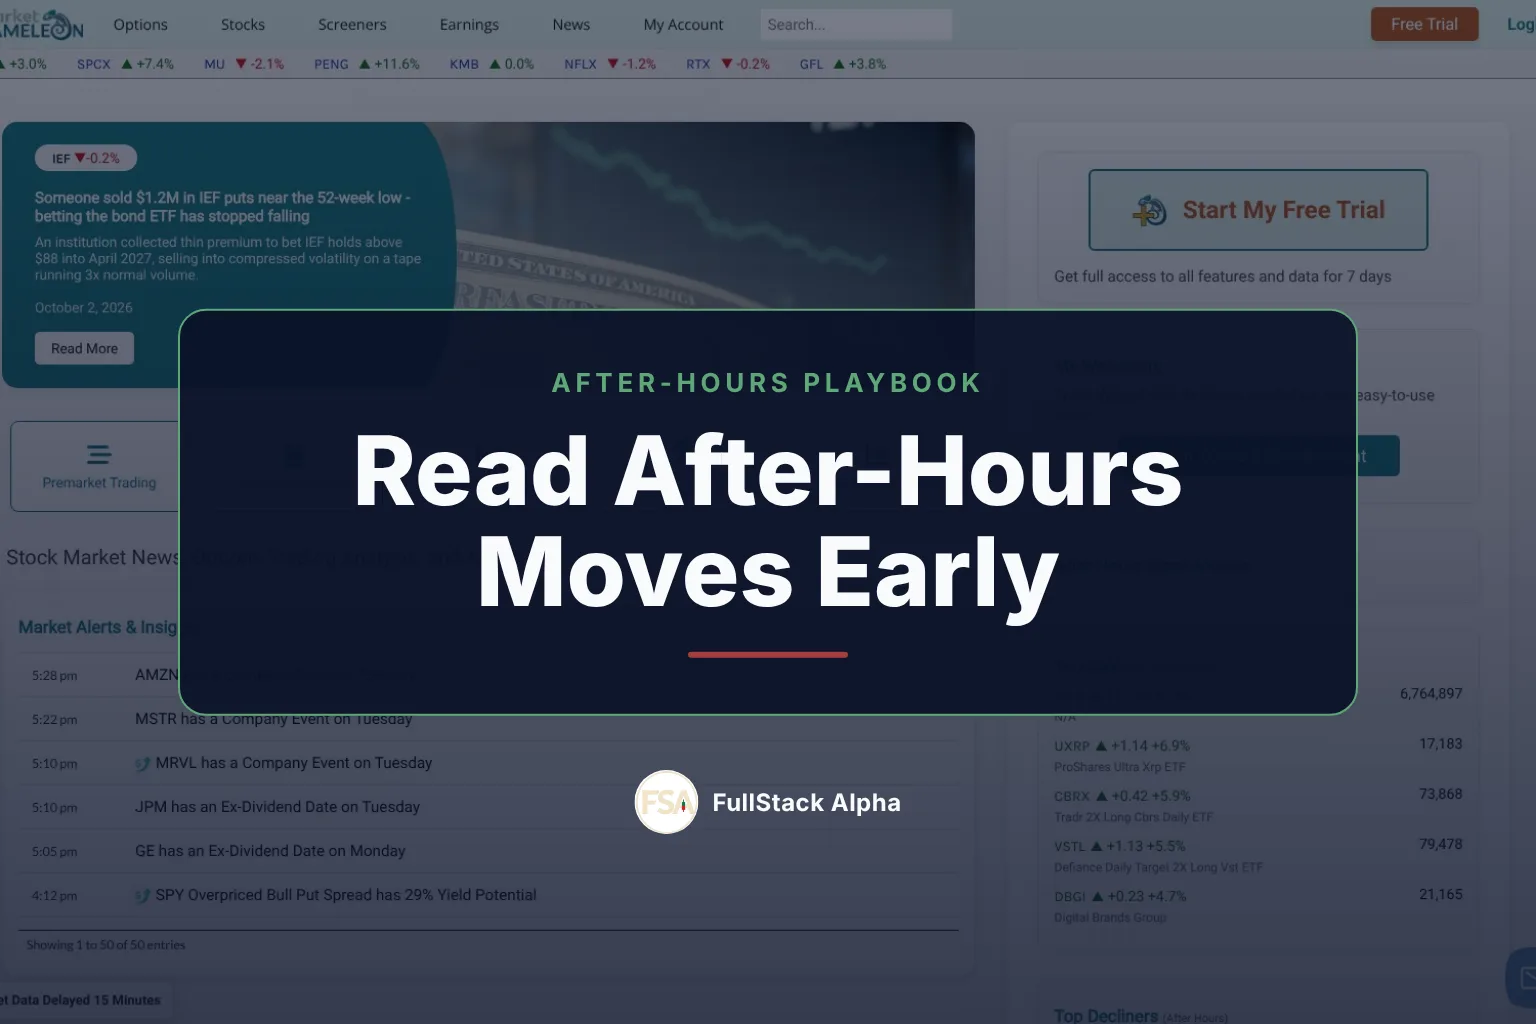
On October 28, 2026, Fortinet dropped 25.7% after the bell while Alphabet's GOOGL shed 10.0% on 22.9 million shares of post-market volume, according to 
Quick answer: what Market Chameleon after hours shows and the 3 numbers to check first
Market Chameleon after hours data starts with a free movers report, delayed 15 minutes, that splits post-market trading into gainers, decliners, and the most active names, with after-hours volume attached. A separate after-hours screener layers session-specific analytics on top. The paid Premium tier adds 20 days of VWAP history and downloadable minute-by-minute files.
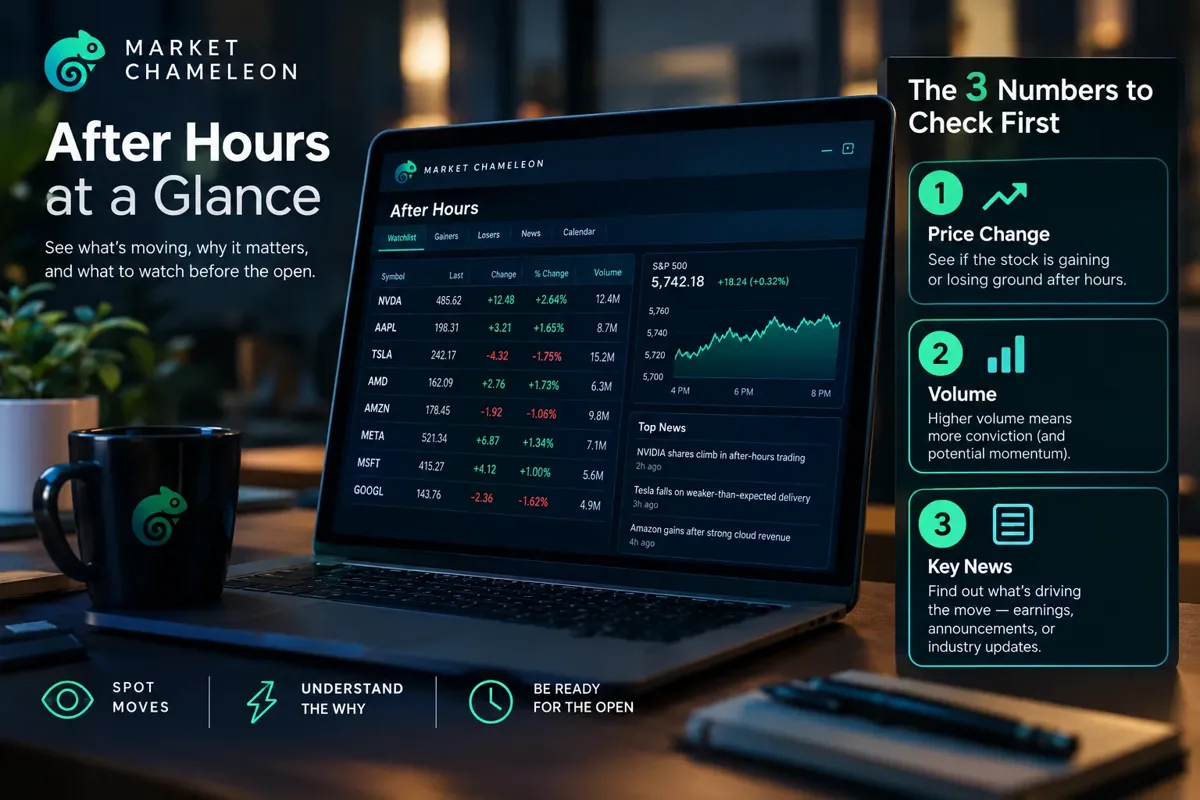
The three numbers to check, in this order:
- After-hours volume. How many shares actually traded. A 30% move on 4,000 shares is one person's limit order, not a signal.
- Relative volume. Market Chameleon defines this as current after-hours volume divided by the 20-day average after-hours volume. A reading of 10 or more means a crowd showed up, not a straggler.
- Distance from VWAP. VWAP is the volume-weighted average price, the average price weighted by how many shares traded there. Price fading under after-hours VWAP means late sellers are winning.
Percentage change is the headline. Volume, relative volume, and VWAP are the story.
Read Market Chameleon after hours data in that order, and everything below shows how to do it without talking yourself into a trade you'd regret at 9:31 a.m.
What does Market Chameleon show after hours?
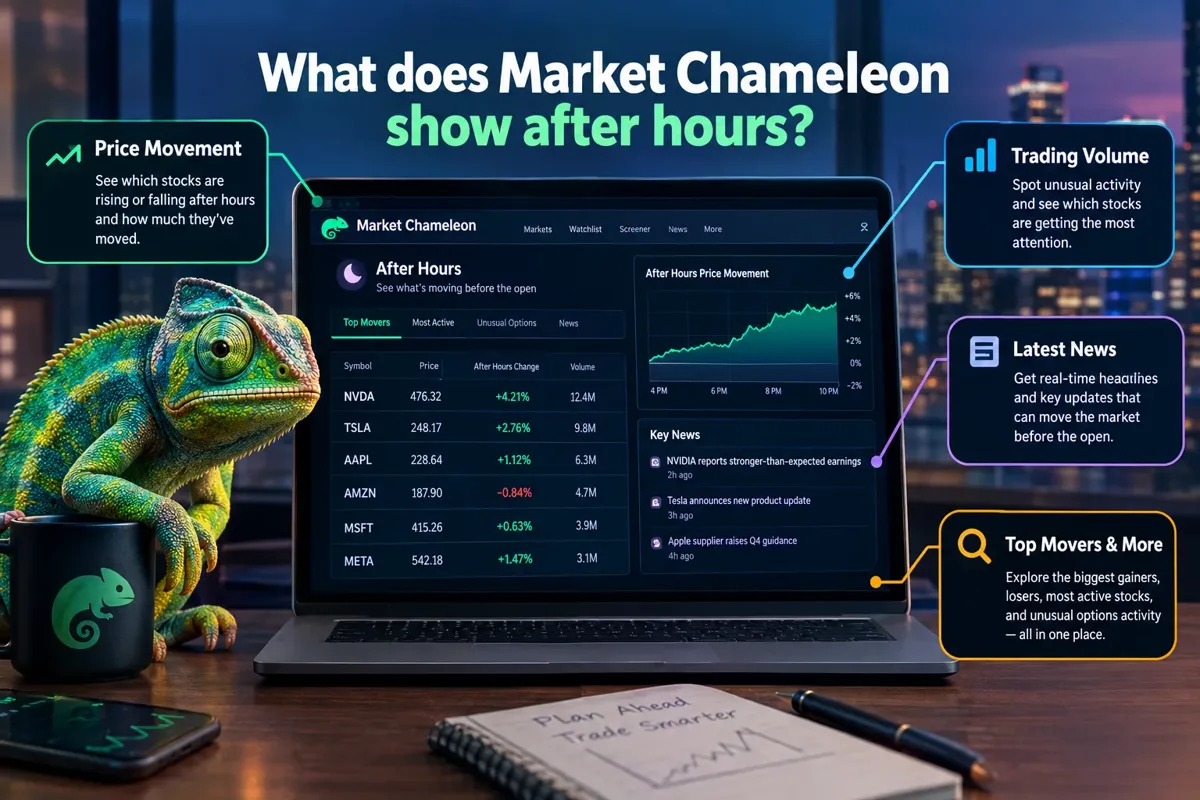
Market Chameleon after hours coverage comes in two pieces: a movers report that sorts post-market gainers, decliners, and most-active stocks with price and volume attached, and an after-hours screener that lets you filter the universe by session-specific criteria. They answer different questions, and mixing them up is where most people waste their evening.
The movers report answers "what's moving right now?" The screener answers "what matches my rules?" A real-time scanner answers "alert me the second this starts happening," and Market Chameleon is not built to be one: it labels its after-hours report and screener data as delayed by 15 minutes.
The fields that actually earn their space
The after-hours screener columns go well past price change:
- After-hours VWAP and price versus VWAP
- 20-day average after-hours volume (the baseline for relative volume)
- Relative volume for the session
- Prior-day high/low breaches: did tonight's print take out yesterday's range?
- Moving-average breaches (20-day, 50-day, and 250-day)
- An earnings filter and a news column for stocks that just reported or issued a press release
That earnings filter matters more than it looks. On October 28, the board was loaded with big single-name moves: Porch Group up 22.2%, Glaukos up 17.6%, Sprouts Farmers Market down 23.0%, Fortinet down 25.7%. Late October is peak earnings season, and earnings season turns the after-hours page from a trickle into a firehose.
How big is the list, really
The screener covers far more than familiar stocks. The October 28 movers list mixed household names with leveraged ETFs like LITG, LITU, and SOXL. If your process is "scroll until something looks exciting," you've already lost. The breadth is a feature only if you filter aggressively.
Decision rule: if a name on the Market Chameleon after hours list has under roughly 50,000 shares of after-hours volume and no earnings or news flag, ignore it. No exceptions, no "but what if." Thin tape after hours produces prices that don't survive contact with the opening auction.
How do you read the after-hours movers page, step by step?
Read the Market Chameleon after hours page in a fixed order: sort by volume first, then check relative volume, then compare price to VWAP, then confirm a catalyst, then write down a level. Reading it in any other order means you're letting the biggest percentage number pick your trades for you.
Step 1: Sort by volume, not percent change
The gainers and decliners views lead with percent change because that's what gets clicks. Start with the most-active view instead. The names with the most shares traded after hours are the ones where real institutional and informed retail money is repricing the stock. Alphabet's 22.9 million GOOGL shares and 13.4 million GOOG shares on October 28 told you the market had genuinely re-rated the name. A microcap up 40% on 9,000 shares told you nothing.
Step 2: Check relative volume against the 20-day baseline
Raw volume is context-dependent. Two million shares is enormous for a quiet midcap and a rounding error for a mega-cap. Relative volume fixes that by dividing tonight's number by the 20-day after-hours average. A reading of 40 means roughly forty times the stock's normal post-market participation.
Rough working bands to use as a starting filter, not gospel:
| Relative volume | What it usually means | What to do |
|---|---|---|
| Under 2x | Normal drift, no real news | Skip it |
| 2x to 10x | Something happened, modest interest | Watch, don't act |
| 10x to 25x | Real catalyst, real participation | Add to watchlist |
| Above 25x | Major repricing event | Study it, plan a level |
Step 3: Compare price to after-hours VWAP
VWAP after hours is the session's volume-weighted average price. If a stock spiked to +12% on the headline and is now trading below its after-hours VWAP, the early buyers are underwater and sellers have the upper hand. That's a fading move, and fading moves often open weaker than the last print suggests.
VWAP is confirmation, never a standalone signal. A stock above after-hours VWAP on 20x relative volume with an earnings beat is a different animal from a stock above VWAP on 1.5x volume with no news.
Step 4: Confirm the catalyst
Open the attached news or earnings flag. Guidance cut? Beat-and-raise? CFO resignation? The type of catalyst shapes how long the move lasts. Earnings reactions tend to carry into the next session. Vague "strategic review" headlines on low float names tend to round-trip by lunch.
Step 5: Write down one level
Before you close the laptop, write a single price for each name: the level where you'd act and the level where you'd admit you're wrong. If you can't define both, the setup isn't clean enough. This is the same discipline that makes a swing trade scanner useful instead of overwhelming.
Common mistake: treating the 7:59 p.m. price as the opening price. It isn't. Overnight futures, European trading, and the pre-market auction all get a vote before 9:30.
Which after-hours moves actually hold into the next open?
Moves backed by high relative volume, a hard catalyst (earnings, FDA decision, M&A, guidance change), and price holding above after-hours VWAP hold into the open far more often than thin, newsless spikes, no matter how loud the Market Chameleon after hours board looks. Nobody can quote you a reliable percentage, and anyone who does is selling something.
What separates the two
The structural problem with extended hours is liquidity. FINRA warns that extended-hours markets generally have lower liquidity than the regular session, and the SEC points to wider spreads and greater volatility. Those conditions mean a handful of prints can set a price that no large buyer would ever pay in regular hours.

Moves that tend to hold:
- Earnings with a revenue and guidance beat, heavy volume, price near session highs
- Acquisition announcements at a stated cash price (the stock pins near the deal price)
- Large-cap repricings where millions of shares change hands
- Breaks of the prior-day high or low on volume
Moves that tend to fade:
- Low float names with no news (low float means few shares available to trade, so small orders move price a lot)
- Spikes on under 20,000 shares
- Price already well below after-hours VWAP by 7 p.m.
- Secondary offerings and dilution headlines that "bounce" on relief
Why some stocks move more after hours than others
Three drivers do most of the work. First, share count available to trade: a low float stock with 8 million shares outstanding will swing violently on volume that wouldn't register in Apple. Second, catalyst timing: most companies report earnings after the close precisely because the market has time to digest it. Third, options positioning. A name with heavy open interest near the current strike gets extra pressure as dealers hedge, which is why cross-checking unusual options activity before the move adds useful context to an after-hours read.
Edge case worth knowing: a stock can be up 8% after hours at 5 p.m., down 2% by 8 p.m., and open up 4%. The 4:05 p.m. print is the noisiest data point of the entire session. Let the first hour settle before you form an opinion.
How do you use the Market Chameleon dividend calendar?
The market chameleon dividend calendar matters to anyone reading Market Chameleon after hours data for one specific reason: it tells you when a stock is about to open lower for a reason that has nothing to do with bad news. On the ex-dividend date, the stock typically opens down by roughly the dividend amount. That's mechanics, not sentiment.
On the site, this lives in the Future Ex-Dividend Dates report under the Dividends menu. It lists upcoming announced and projected ex-dates, filters by watchlist, ex-date, stock type, and market cap, and exports to CSV. Market Chameleon says the report is fully functional for premium subscribers.
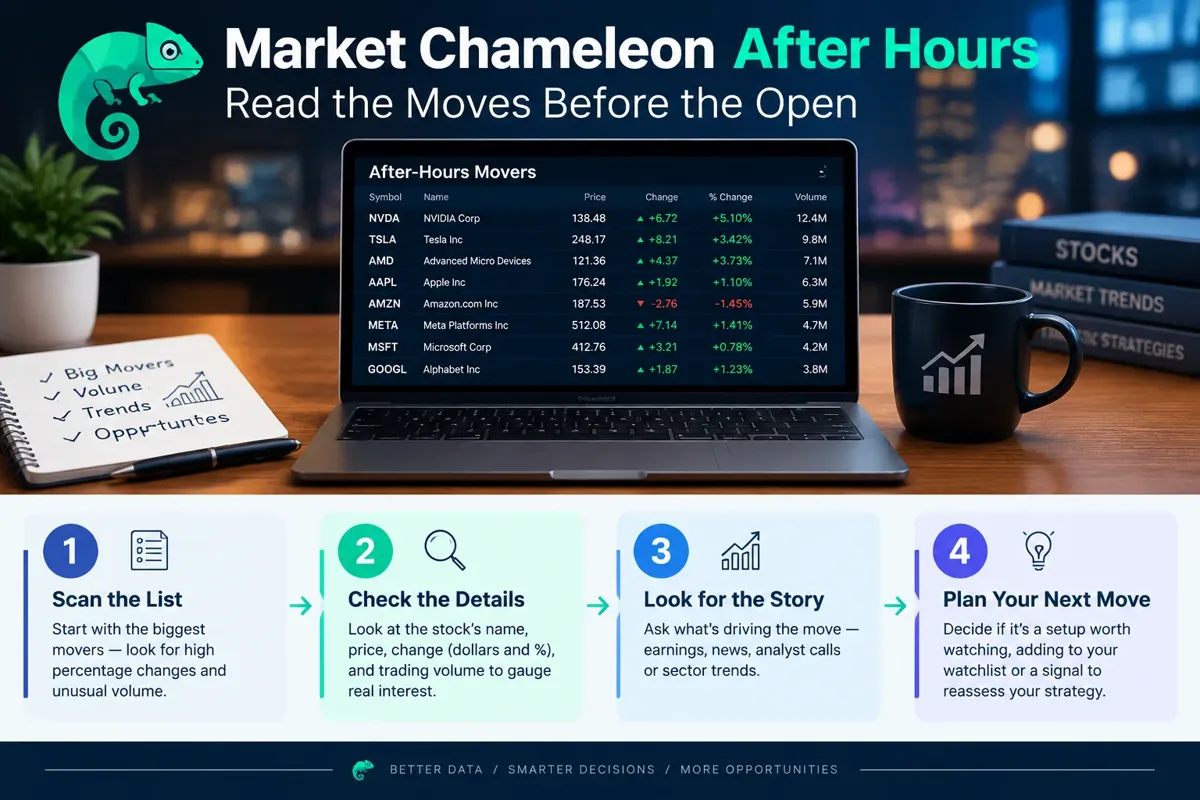
Swing and options traders use it three ways.
Catching mechanical gaps that aren't signals
A stock trading flat after hours that opens down 1.8% the next morning on an ex-dividend date isn't broken. If you don't check the calendar, you'll read that gap as weakness, widen your stop, and get chopped out of a position that was fine.
Decision rule: before you set an overnight stop on any dividend payer, check whether tomorrow is the ex-date. If it is, your stop needs to sit below the price minus the dividend, or you're handing the market a free exit.
Options traders and early assignment
If you're short a call that's in the money and the ex-dividend date lands tomorrow, assignment risk spikes. The calendar is the cheapest early-warning system you'll find for that, and missing it is a classic, entirely avoidable way to turn a profitable trade into a mess.
Building an income watchlist
Filter upcoming ex-dates by your watchlist and market cap, export the list, then check each name's yield and payout history before you cross-reference how the stock behaved in past post-earnings sessions. Dividend announcements and dividend cuts both show up in after-hours tape, and a cut is one of the few headlines that reliably produces a move that holds.
What it isn't good for: dividend capture as a strategy. Buying the day before the ex-date and selling after collects the dividend and usually hands back an equivalent amount in price, minus your costs and taxes. Play stupid games.
How do you use the Market Chameleon earnings calendar with after-hours data?
The market chameleon earnings calendar is the piece that makes Market Chameleon after hours data predictable instead of reactive. Check it before the close, not after, so you know which names are about to report and can have levels written down before the headline hits.
Pair the two tools like this:
Before 4:00 p.m. Pull tomorrow's and tonight's reporters. Note which ones are on your watchlist. The earnings calendar flags each report as before the open or after the close and shows an "Expected % Move" column, built from the at-the-money straddle that expires after the event. That number is your baseline expectation.
4:05 to 5:00 p.m. Headlines land. Resist acting. The first prints are the widest spreads of the night.
5:00 to 6:00 p.m. The call is usually running. Guidance commentary during the call often moves the stock more than the headline numbers alone.
6:00 to 8:00 p.m. Now the data is usable. Volume has accumulated, VWAP means something, and relative volume is calculated against a real sample.
The implied move comparison
Here's the single most useful earnings read available to an options trader. Compare the actual after-hours move to the expected move:
- Actual move far smaller than expected: options were overpriced into the event, premium sellers won, the stock likely drifts
- Actual move roughly equal to expected: efficiently priced, no edge either direction
- Actual move far larger than expected: a genuine surprise, and these are the reactions most likely to continue for multiple sessions
If the calendar priced a single-digit move for a large software name and it fell 25.7%, as Fortinet did on October 28, that's the third bucket. Reactions that size rarely resolve in one session.
Common mistake: chasing the first green candle at 9:30 on an earnings gap. If your only reason to buy is that it already moved, that's FOMO, not a setup. Use the pre-market auction to see where real size wants to transact, which is the same logic behind reading pre-market futures signals that actually predict the open.
A 15-minute evening routine (numbered)
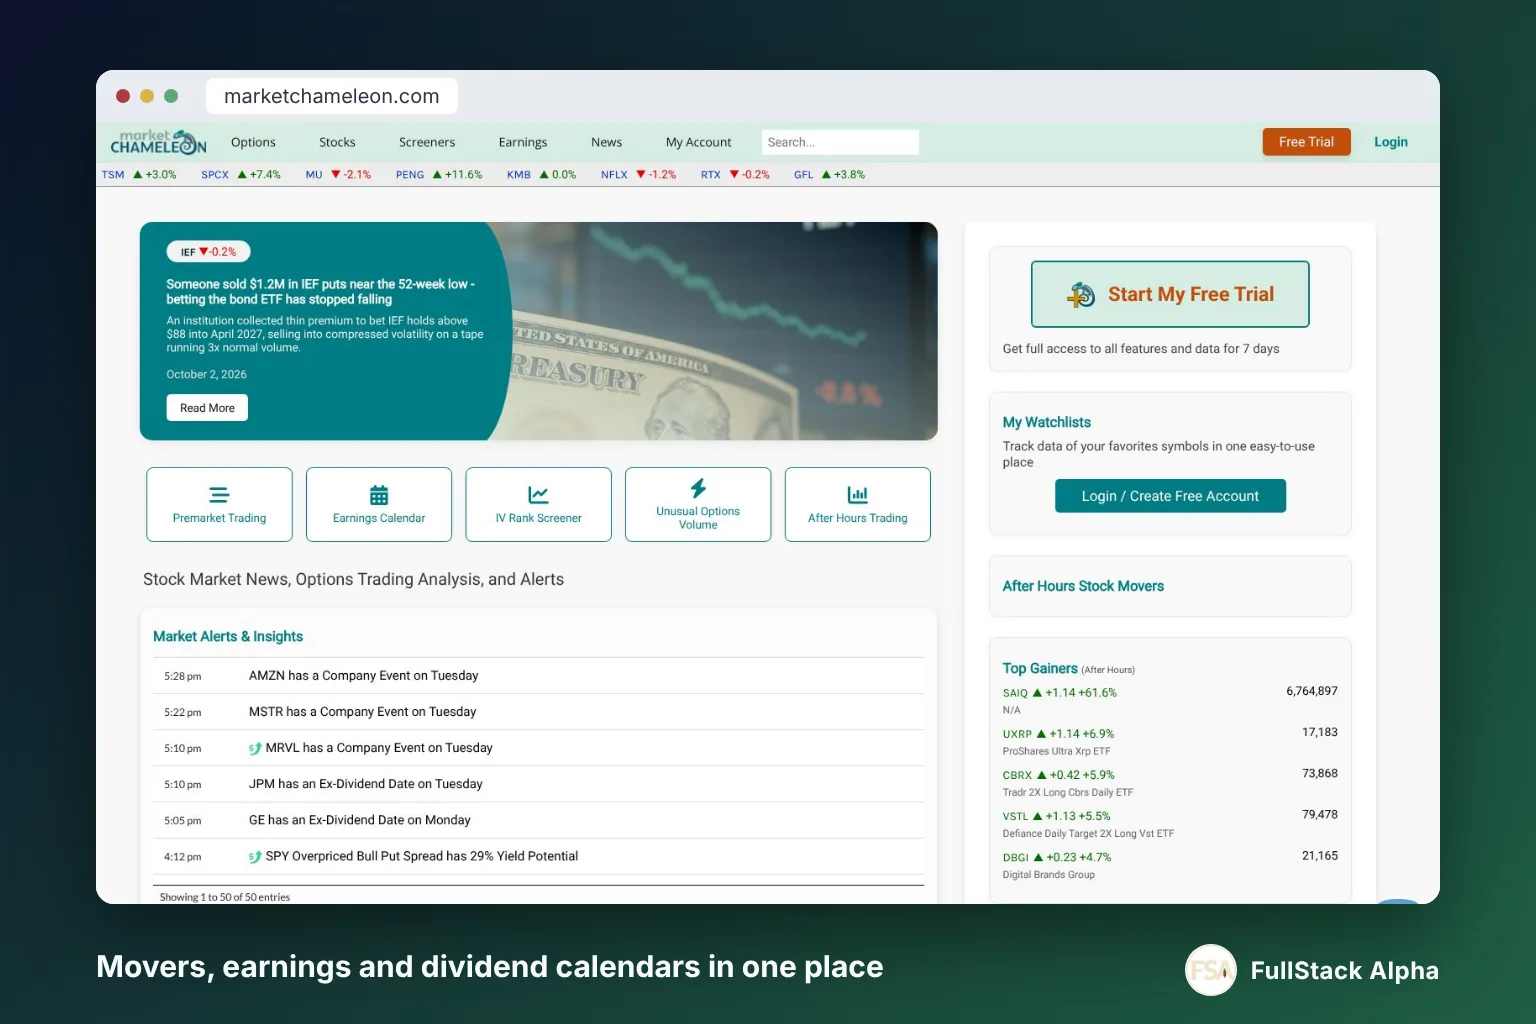
Fifteen minutes, every trading day, in the same order. The point of a fixed sequence is that it removes the decision of what to look at, which is where analysis paralysis starts.
-
Minutes 0-2: Open the Market Chameleon after hours movers report. Start with the most-active view, not percent change. Scan the top 20 rows.
-
Minutes 2-4: Flag anything above 10x relative volume. Use the 20-day after-hours baseline the screener calculates for you. Everything under 10x gets ignored tonight.
-
Minutes 4-6: Check the catalyst on each flagged name. Earnings, news, M&A, offering, or nothing. If the answer is "nothing," delete it from the list.
-
Minutes 6-8: Compare each survivor's price to after-hours VWAP. Above VWAP and holding is a continuation candidate. Below VWAP and sliding is a fade candidate or a pass.
-
Minutes 8-10: Pull tomorrow's earnings calendar. Note the names reporting before the open. Those will gap, and you want the expected move written down tonight.
-
Minutes 10-11: Check the dividend calendar for ex-dates. Adjust any overnight stops on dividend payers so a mechanical gap doesn't stop you out.
-
Minutes 11-13: Write two prices per name. Entry trigger and invalidation. If you can't define the invalidation, the name doesn't make the watchlist. Position sizing comes from the distance between those two numbers, not from how excited you feel.
-
Minutes 13-15: Close the laptop. Set alerts at your levels. Do not re-check the tape at 11 p.m. Staring at a thin market until midnight has never improved anyone's entry.
Decision rule for the whole routine: the maximum output is three names. Not twelve. Three. A watchlist you can actually monitor at the open beats a spreadsheet you abandon by 9:35.
Paper trade the routine for two weeks before you risk money on it. Track which of your three names actually followed through. You'll learn more from that log than from any tutorial, and it's the same discipline that separates useful AI swing trading tools from expensive dashboards.
What does Market Chameleon cost for these tools?
The Market Chameleon after hours movers list is free to view, delayed 15 minutes. Market chameleon pricing for Premium is $99 a month with a 7-day free trial. Premium adds the depth that matters if you're trading these moves rather than reading about them: VWAP for the premarket, main session, or after hours for up to the last 20 available trading days, plus downloadable minute-by-minute price, VWAP, high, low, and volume data. A higher Total Access tier is also listed, but its price isn't shown on the Premium page, so confirm it there before you commit.
Hunting for a lower price? Check our AI stock tool deals page.
Free versus paid, practically
| What you need | Free tier handles it? |
|---|---|
| See tonight's biggest movers and volume | Yes, delayed 15 minutes |
| Check relative volume vs 20-day average | Shown in the after-hours screener |
| Pull 20 days of historical after-hours VWAP | No, Premium |
| Download minute-by-minute session data | No, Premium |
| Full upcoming ex-dividend dates report | No, fully functional on Premium |
| Real-time streaming alerts as moves begin | Not the platform's strength |
That last row is the honest limitation. The Trade Ideas roundup rates Market Chameleon "Strong" for catalyst and news context and calls it best suited to earnings and event-driven research, while labeling its alerts and AI features "Limited." That's a fair read. It's a research desk, not a siren. If you want alerts that fire on their own, a setup like 
Who should pay and who shouldn't
Pay if: you trade earnings reactions regularly, you sell options premium into events, or you want to study how after-hours moves resolved using historical VWAP and minute data.
Don't pay if: you check the market twice a week, you hold positions for months, or you haven't yet built a repeatable process. A subscription won't fix a missing system. Our full Market Chameleon scorecard and the longer Market Chameleon deep dive break down where it earns its verdict and where it doesn't.
Where it fits against alternatives
Market Chameleon sits in the screener category, and the directory lists Market Chameleon alternatives if the fit is wrong. A market chameleon premarket view extends the same logic into the morning session through its premarket trading report, and the platform's instructional library includes a walkthrough on reading SPX premarket options activity before the open. Dedicated real-time scanners cover the alerting gap. Broker platforms cover execution. Nothing covers all three well, and the traders who do best usually run two tools, not six.
References
- Market Chameleon, Stock After Hours Trading Report. marketchameleon.com.
- Market Chameleon, Premium. marketchameleon.com.
- Market Chameleon, After Hours Screener. marketchameleon.com.
- Market Chameleon, Earnings Calendar. marketchameleon.com.
- Market Chameleon, Future Ex-Dividend Dates Report. marketchameleon.com.
- Trade Ideas, 7 Best After Hours Stock Screeners for Active Traders in 2026. trade-ideas.com.
- Market Chameleon, SPX Premarket Options Activity and Early Insights Before the Open. marketchameleon.com.
Picking a screener for your evening routine? The FullStack Alpha directory catalogs 200+ AI stock tools by category, price and what they actually do. Compare stock screeners in the directory
This is education, not financial advice.
Your market edge starts with the right tool. Stay alpha.
Some links on this page may be affiliate links. Scores and verdicts are never influenced by them.
Prices are subject to change as fast as AI technology.
We test the tools. You get the verdict.
One email a week. What we tested, what scored, and what we'd skip. Written for traders, not for clicks.
Frequently asked
More from FullStack Alpha