

Market Chameleon Review: What $99 a Month Actually Buys
Short on time? The Market Chameleon Alpha Score scorecard breaks the 67/100 down by pillar, with pricing and the verdict, in about 90 seconds.
See the score
Quick Answer: Market Chameleon Total Access runs $99 a month with a 7-day free trial, and what that money buys is data depth: options screeners, implied volatility history, earnings implied move studies, unusual option volume and premarket pages. Market Chameleon Review: What $99 a Month Actually Buys comes down to one trade off, you are paying for research plumbing, not for trade alerts. The FullStack Alpha desk scores it 67 out of 100. Strong signal, honest pricing, dense interface, and thin public discussion.
Key Takeaways
- Price checked: Total Access is $99 per month with a 7-day free trial, and a narrower Earnings package exists for traders who only want the earnings side.
- Alpha Score 67 out of 100: Signal Quality 17, Transparency 15, Price-to-Value 14, Usability 13, Community Verdict 8.
- Barchart undercuts it badly on price: Free, Plus at $9.99 a month, Premier at $29.95 a month, with the first 30 days free.
- Options depth is the real product: reviewers consistently point to the options and volatility screeners as the reason to pay.
- Public reviews are thin: no verified Apple App Store listing and no usable Trustpilot profile, so the Community Verdict pillar sits at 8 out of 20.
- Free sampling exists: MarketChameleon market commentary appears as third party content on IBKR Traders' Insight, part of the free IBKR Campus library.
Market Chameleon review: is it worth $99 a month?
Yes, if you trade options around earnings at least twice a month and you currently guess at implied volatility. No, if you are a stock-only swing trader who wants charts and a watchlist, because $99 buys nothing you need. The honest test is simple: can you name three decisions this data would change next week?
Most traders who cancel a $99 tool do it because they bought capability instead of answering a question. Options data is like a commercial kitchen. Spectacular if you cook every night, absurd if you order takeout.
Market Chameleon at a glance
Best for: earnings and options traders who size positions off implied volatility.
- Day trader: Okay fit, premarket and unusual volume pages help.
- Swing trader: Strong fit, earnings studies guide entries.
- Scalper: Weak fit, not a low latency execution tool.
- Long-term investor: Weak fit, too much options machinery.
Price: $99 per month, Total Access.
Watch out for: a dense, table heavy interface with a real learning curve.
What is Market Chameleon and how does it work?
Market Chameleon is a web based options and equities research platform that turns raw market data into pre-built studies: implied volatility history, earnings reaction tables, option volume leaders and screeners you can filter by symbol, option volume, strategy and expiration. It does not route orders and it does not pick stocks for you.
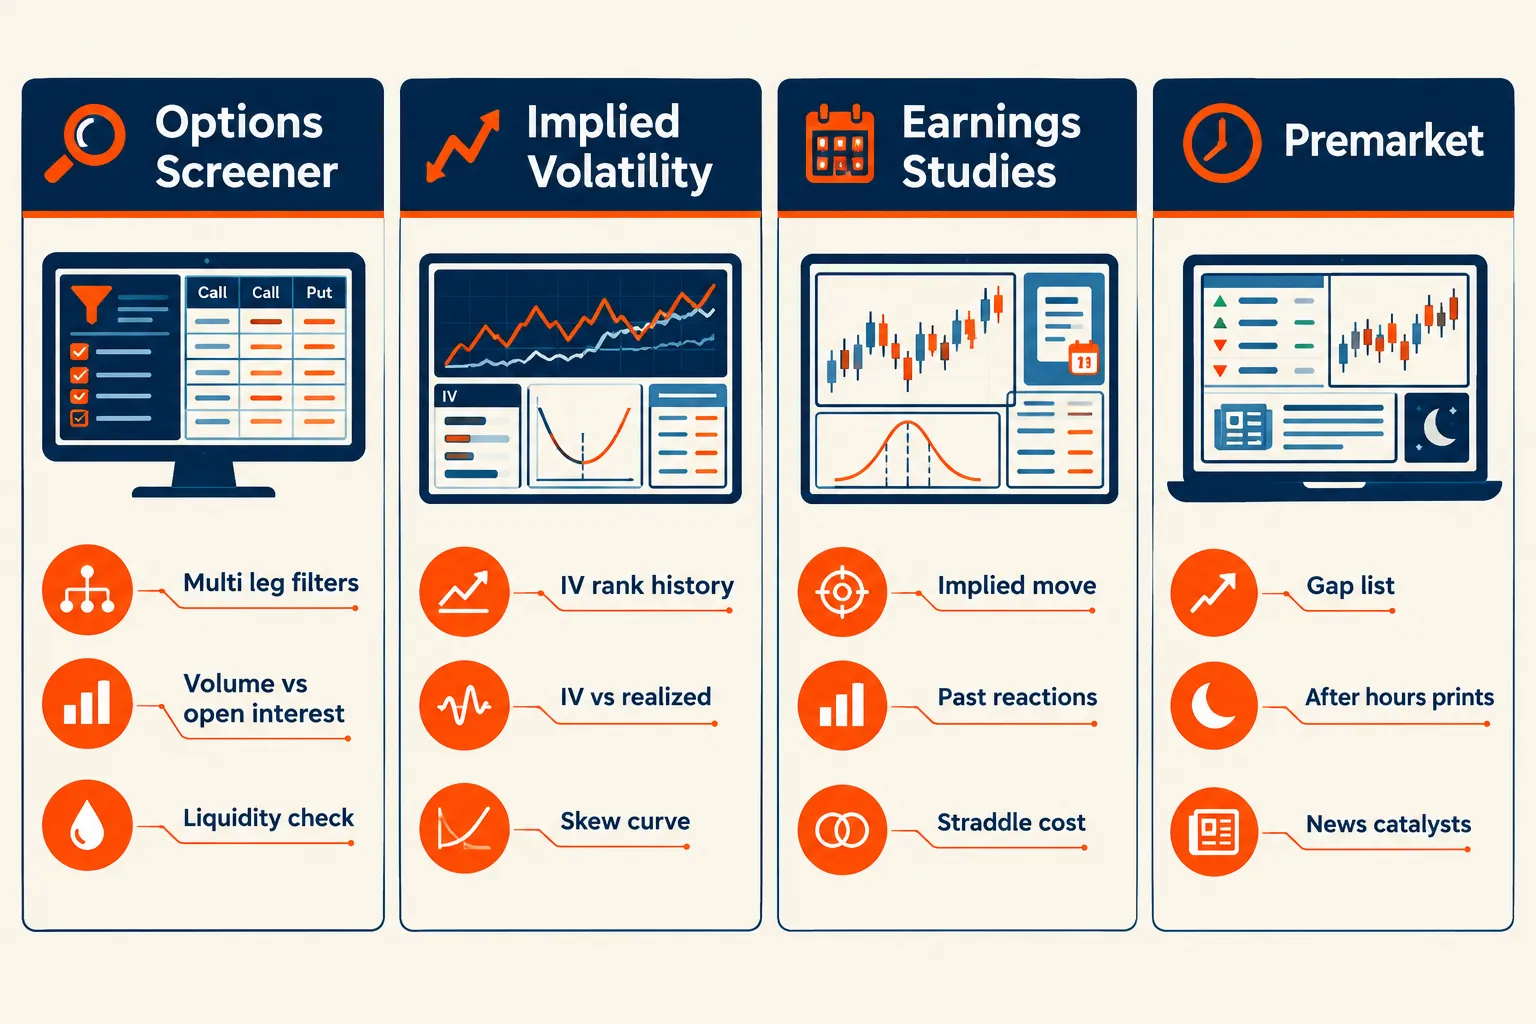
The mechanics are unglamorous and that is the point. It ingests options chains and price history across stocks, options, futures and ETFs, computes derived stats, then serves them as sortable tables. One published walkthrough shows the earnings and implied move workflow being driven straight from those tables. Independent write ups describe it the same way, as a data and screening platform rather than a signal service.
Decision rule: if your process starts with "what is the option market pricing in," this fits. If it starts with "what should I buy," it does not.
Market Chameleon price: what does Total Access include?
Total Access is $99 per month with a 7-day free trial. The price has been steady and there is no deep long term discount being dangled, which is more respectable than the usual fake countdown clock.
What the $99 tier opens up, per the official page and third party reviews:
- Full options screeners, including multi leg and Multi-expiration setups
- Implied volatility history, IV rank and IV versus realized comparisons
- Earnings implied move studies and historical reaction tables
- Unusual option volume, option volume leaders and VWAP style activity views
- Premarket and after hours pages, plus news and market commentary
- Data export, with caps that reviewers note are generous but not unlimited
A cheaper, narrower Earnings plan covers the earnings tools alone. Several reviews treat Total Access as the only tier worth buying if you want both options and earnings coverage, a reading echoed by this platform breakdown.
Does Market Chameleon have a free trial, and how do you cancel?
Yes. The 7-day free trial is listed on the Total Access page. Cancel inside your account settings under the subscription section before day seven, and confirm you see a cancellation notice rather than assuming. Put a calendar reminder on day five. Trials end quietly, billing does not.
How do the Market Chameleon earnings tools work?
The Market Chameleon earnings tools price the event before it happens. They show the implied move the options market expects, then stack it against how the stock actually reacted to prior reports, so you can see whether a straddle is historically cheap or expensive.
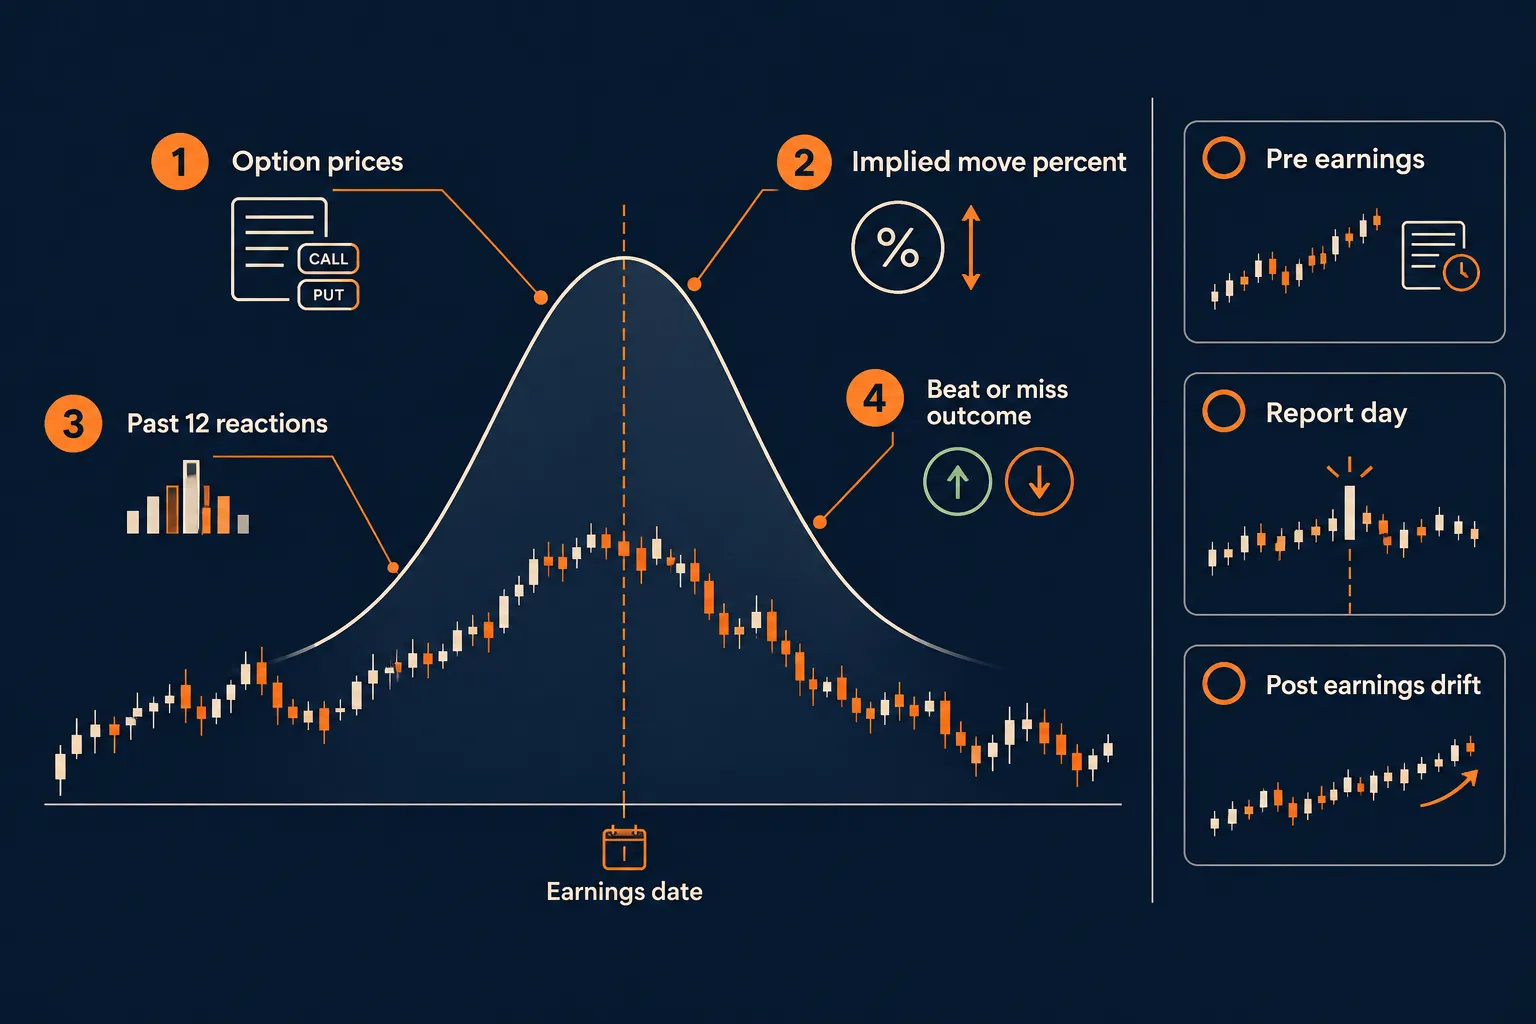
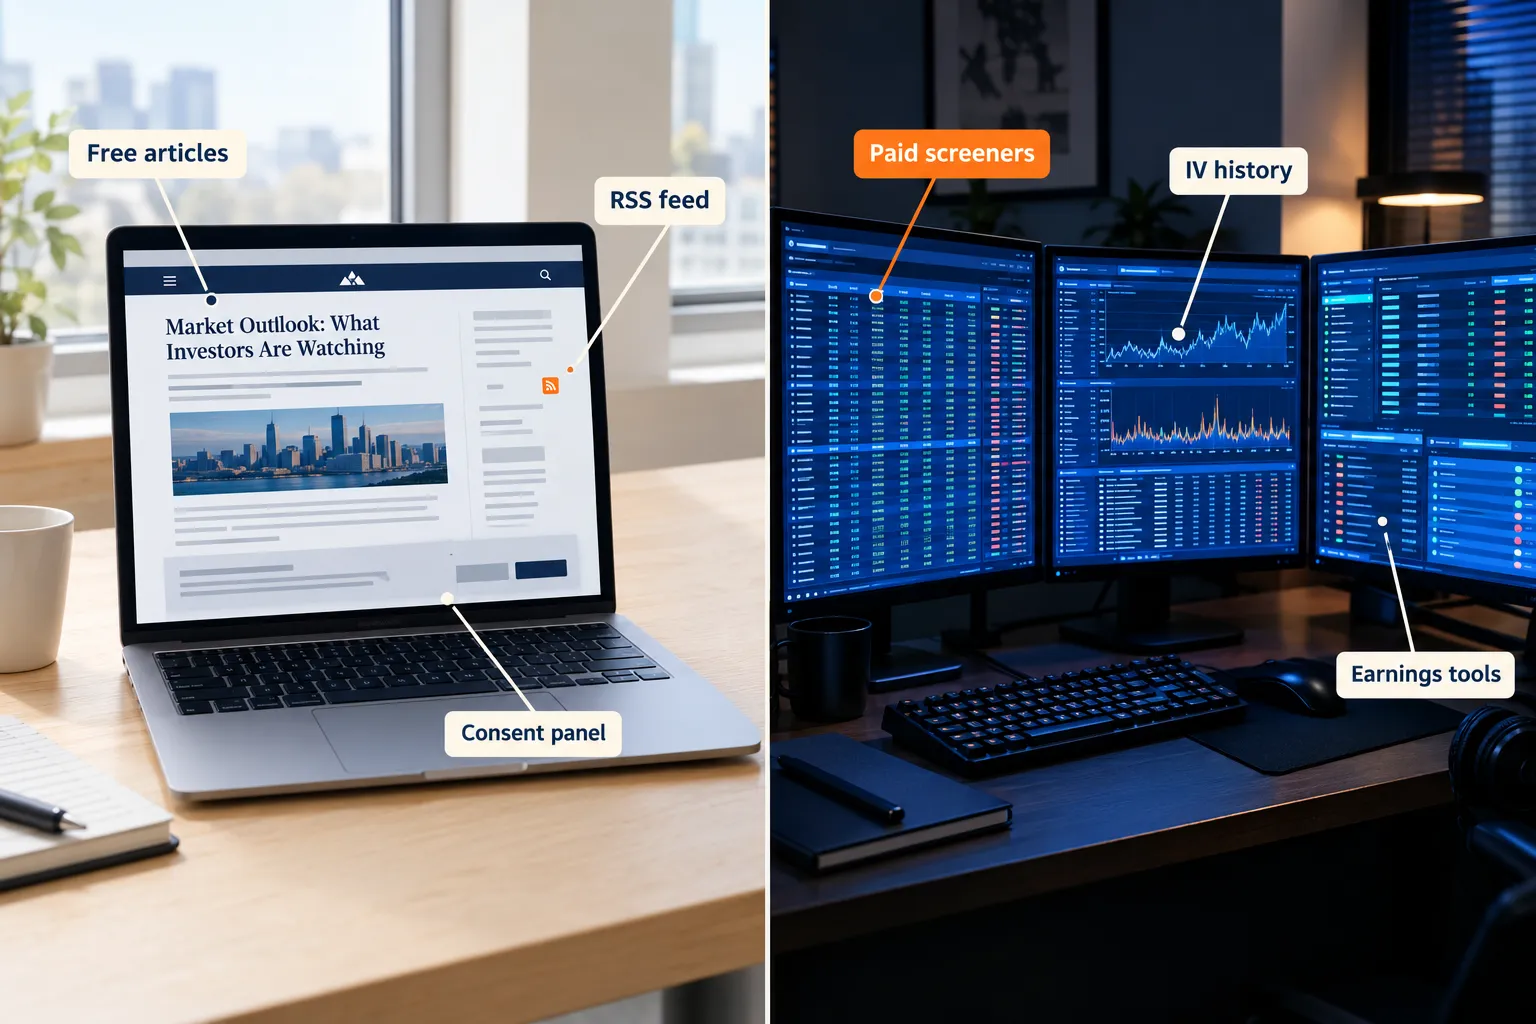
Typical workflow for an April or Sep expiration play:
- Pull the earnings calendar and sort by implied move
- Compare the implied move to the average absolute move of the last 8 to 12 reports
- Check IV rank to see where volatility sits versus its own year
- Decide whether you are a seller of premium or a buyer of movement
- Size the position first, pick the strike second
Reviewers repeatedly flag the earnings suite as the platform's strongest block, including this options screener roundup. The common mistake: traders read a 9% implied move as a prediction. It is a price, not a forecast.
How does the Market Chameleon premarket data help day traders?
Market Chameleon premarket pages give day traders the gap list, after hours prints and overnight news in one place, so the watchlist is built before the open rather than during it. Useful, not unique, and this is exactly where free tools get close.
- Premarket gap and volume leaders ranked by percentage and dollar volume
- After hours movers from the prior session, with the news catalyst attached
- Earnings-dated names flagged so you know what is reacting and why
- Option volume context on gappers, which free gap screeners rarely show
If premarket is your whole use case, read our breakdown of the premarket futures signals that actually predict the open before you pay anything. The option volume layer is the only part of the premarket page that is hard to replace.
Can you find the highest IV stocks today with Market Chameleon?
Yes. A high IV stocks screener is one of the platform's core pages, and you can rank the highest IV stocks today by IV rank, IV percentile, or IV versus realized volatility rather than raw IV, which is what actually matters. Raw IV just tells you a stock is jumpy. IV rank tells you whether it is jumpy relative to itself.
On screener accuracy: the filters return what you asked for, and the data lines up with broker chains on liquid names. Where it gets soft is thin, low float tickers with wide spreads, where a screener can show attractive premium that you will never fill at the market price. Check the spread before you believe the screen. That is true of every options screener, not just this one.
Market Chameleon vs Barchart, Finviz and thinkorswim
Market Chameleon wins on options and earnings depth. Barchart wins on price. Finviz wins on stock screening speed. thinkorswim wins because it is attached to your broker and costs nothing extra. Pick by which job you are actually hiring for.
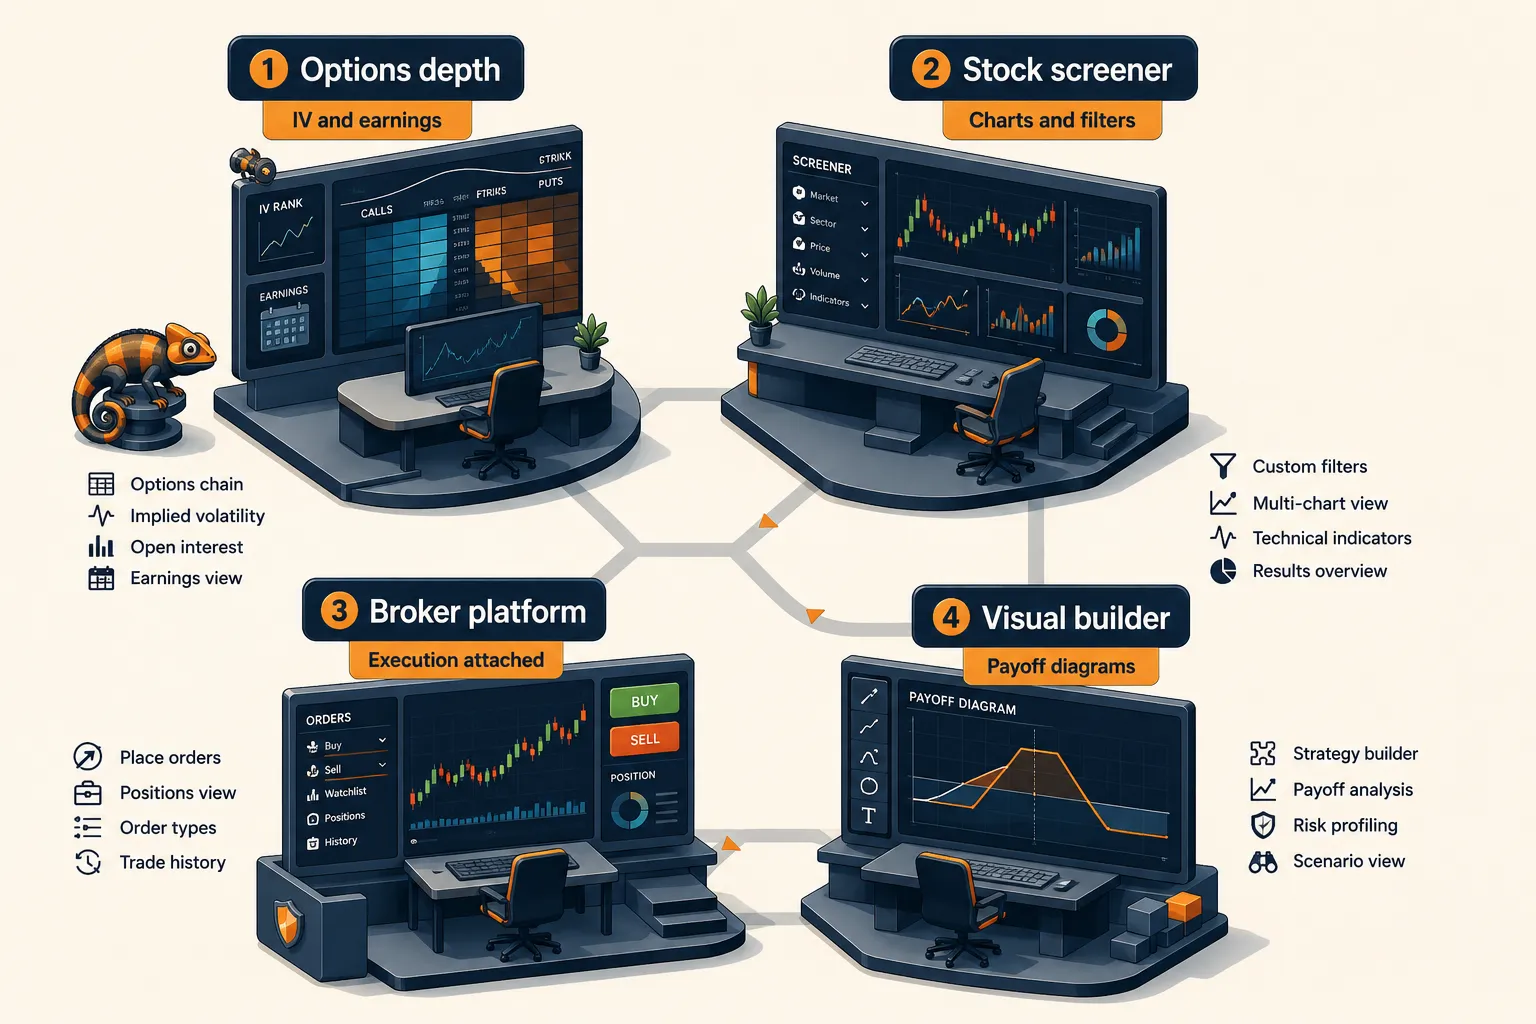
- Market Chameleon vs Barchart: Barchart's Plus tier is $9.99 a month or $99 a year, Premier is $29.95 a month or $239.95 a year, with the first 30 days free. Barchart covers more asset classes for less. Market Chameleon goes deeper on volatility and earnings. If options are a side dish, Barchart Premier is the better buy.
- Market Chameleon vs Finviz: Finviz is the faster stock screener and the cheaper habit. Our Finviz Elite versus free comparison shows what the upgrade adds. Finviz does not replace IV history.
- Market Chameleon vs thinkorswim: thinkorswim gives you real-time chains, analysis tabs and execution in one window at no extra cost. It does not give you pre-built historical earnings reaction studies. Many traders run thinkorswim for execution and a research tool for the pre-trade work.
- OptionStrat: Free, Live Tools at $39.99 a month, Live Flow at $99.99 a month, with a 7-day trial. Better payoff visualization, less historical depth.
Free alternatives worth trying first: your broker's own chain, Barchart Free, and the free IBKR Traders' Insight commentary. Also see what is options flow before you pay for any flow feed.
Top 5 favorite features in Market Chameleon
The five features that justify the $99, ranked by how often a real trader would open them.
- Earnings implied move table. Implied move next to historical reaction, in one view. This is the headline feature and the instructional walkthrough shows why.
- IV rank and IV history charts. Context for whether premium is rich or cheap today.
- Options screener with multi leg filters. Build the condition, not just the ticker list.
- Unusual option volume and volume leaders. Volume against open interest, which is how you separate real positioning from noise.
- Premarket and after hours pages. Watchlist built before the bell, with news attached.
The Alpha Score Breakdown
Market Chameleon scores 67 out of 100 across five pillars, 20 points each.
Signal Quality 17 / 20
Transparency 15 / 20
Price-to-Value 14 / 20
Usability 13 / 20
Community Verdict 8 / 20
Total 67 / 100
The score comes from FullStack Alpha desk research plus public user sentiment, and the pillar split is provisional.
What we like, and what we don't
Two things we rate highly, two real drawbacks. Every tool gets both, including the ones we recommend.
What we like
- Options and earnings depth that free tools summarize instead of showing, confirmed across multiple independent reviews
- Pricing stated plainly at $99 with a 7-day trial, no fake discount theatre
What we don't like
Watch out for
- Usability, 13 out of 20. The interface is tables on tables. Expect a week before anything feels fast, and the mobile experience is an afterthought.
- Community Verdict, 8 out of 20. Public discussion is thin, so you cannot crowd check your own experience against a large user base.
What do real users say about Market Chameleon?
Honestly, not much, and that is a finding rather than a dodge. Our method combines public user sentiment from Reddit, Trustpilot and the Apple App Store with our five-pillar Alpha Score, and two of those three sources came up empty here.
- Apple App Store: no official iOS app found, so no rating and no review count exists to cite.
- Trustpilot: the profile under a similar name belongs to an unrelated travel business, so it tells you nothing about the trading platform. Ignore anyone who quotes it.
- Reddit: we found no thread with a verifiable permalink worth quoting, so we are not inventing one.
What thin discussion means for a buyer: you are leaning on the 7-day trial and on published reviews such as this one instead of thousands of user data points. Where users and our score agree is simple enough: nobody disputes the data depth. Where the gap sits is Usability, and with so little public feedback you cannot verify that the learning curve flattens. See how we handle thin sentiment in our honest AI stock tool review method.
Can you make money with Market Chameleon, and who gets burned?
No tool makes money. A process makes money, and data either sharpens that process or distracts it. The traders who get value here already have rules for position sizing and exits before they log in.
The four most common mistakes:
- Treating the implied move as a prediction. It is the market price of uncertainty, nothing more.
- Screening the highest IV stocks today and selling premium blind. High IV usually means genuine risk, not free money.
- Opening fourteen tabs and trading none of them. Analysis paralysis costs more than the subscription.
- Paying $99 while using 5% of it. Pick three pages, use only those for 30 days, then decide.
For beginners or experienced traders only? Experienced leans. A beginner should paper trade it first and start with the free IBKR Campus courses. Automation and broker API routing belong on our sister site, aistocktradingbots.com, not here.
Comparison tables: price, rivals, features and fit
Four tables, built for a buying decision rather than for decoration. All prices checked against the official pages linked above.
Price tiers
| Plan | What you get | Best for | Price |
|---|---|---|---|
| Free pages | Limited public data, delayed views | Sampling | $0 |
| Earnings | Earnings studies only | Earnings-only traders | See official page |
| Total Access | Options screeners, IV history, earnings, premarket, exports | Options and earnings traders | $99 / mo, 7-day trial |
Competitors
| Tool | Best for | Key strength | Key weakness | Starting price |
|---|---|---|---|---|
| Market Chameleon | Earnings and IV traders | Options data depth | Dense interface | $99 / mo |
| Barchart | Multi-asset screening | Breadth for the money | Shallower options history | $0, Plus $9.99 / mo |
| OptionStrat | Visual strategy builders | Payoff diagrams | Less historical study data | $0, Live Tools $39.99 / mo |
| Finviz | Stock screening speed | Fast equity filters | No IV history | $0 |
Features
| Feature | Who has it | Our note |
|---|---|---|
| Earnings implied move history | Market Chameleon | The reason to pay |
| IV rank and IV history | Market Chameleon, Barchart Premier | MC goes deeper |
| Premarket gap list | All four | Free versions are adequate |
| Options payoff visualizer | OptionStrat | MC is weaker here |
Who it is for
| Trader type | Pick | Why |
|---|---|---|
| Earnings swing trader | Market Chameleon Total Access | Implied move plus reaction history |
| Day trader | Broker platform plus Barchart | Speed and cost beat depth |
| Scalper | thinkorswim or your broker | Execution first |
| Long-term investor | Finviz free or Barchart Free | No options machinery needed |
FullStack Alpha scorecards
Every tool in this article has a full scorecard: pricing, pros and cons, verified user quotes and the Alpha Score breakdown.
Final verdict: who should pay for Market Chameleon?
Market Chameleon earns its 67 out of 100 by being excellent at one job and indifferent to everything else. Buy it if you trade earnings and volatility and your current process involves eyeballing a chain and hoping. Skip it if you trade stocks, trade rarely, or already pay for two tools you barely open.
The trial is the whole decision. Seven days, one workflow, three pages. If it does not change a trade you were going to make anyway, cancel on day six and keep the $99. Process over prediction.
Still not convinced $99 is better spent here than somewhere else?
Worth it depends on what you are replacing. The FullStack Alpha directory catalogues 200+ AI stock tools, filterable by price, strategy and what they actually do, and the desk has spent $20,000+ on live accounts testing them since 2022.
This is education, not financial advice.
Your market edge starts with the right tool. Stay alpha.
Affiliate disclosure: some links on this page may earn FullStack Alpha a commission at no extra cost to you.
We test the tools. You get the verdict.
One email a week. What we tested, what scored, and what we'd skip. Written for traders, not for clicks.
Frequently asked
Our verdict on Market Chameleon
Market Chameleon scores 67, and signal quality is its strongest pillar at 17.
This is an affiliate link. It never affects our score. Why →