

Finviz Stock Screener: 9 Filters, and What Elite Adds
Short on time? The Finviz Elite Alpha Score scorecard breaks the 90/100 down by pillar, with pricing and the verdict, in about 90 seconds.
See the score
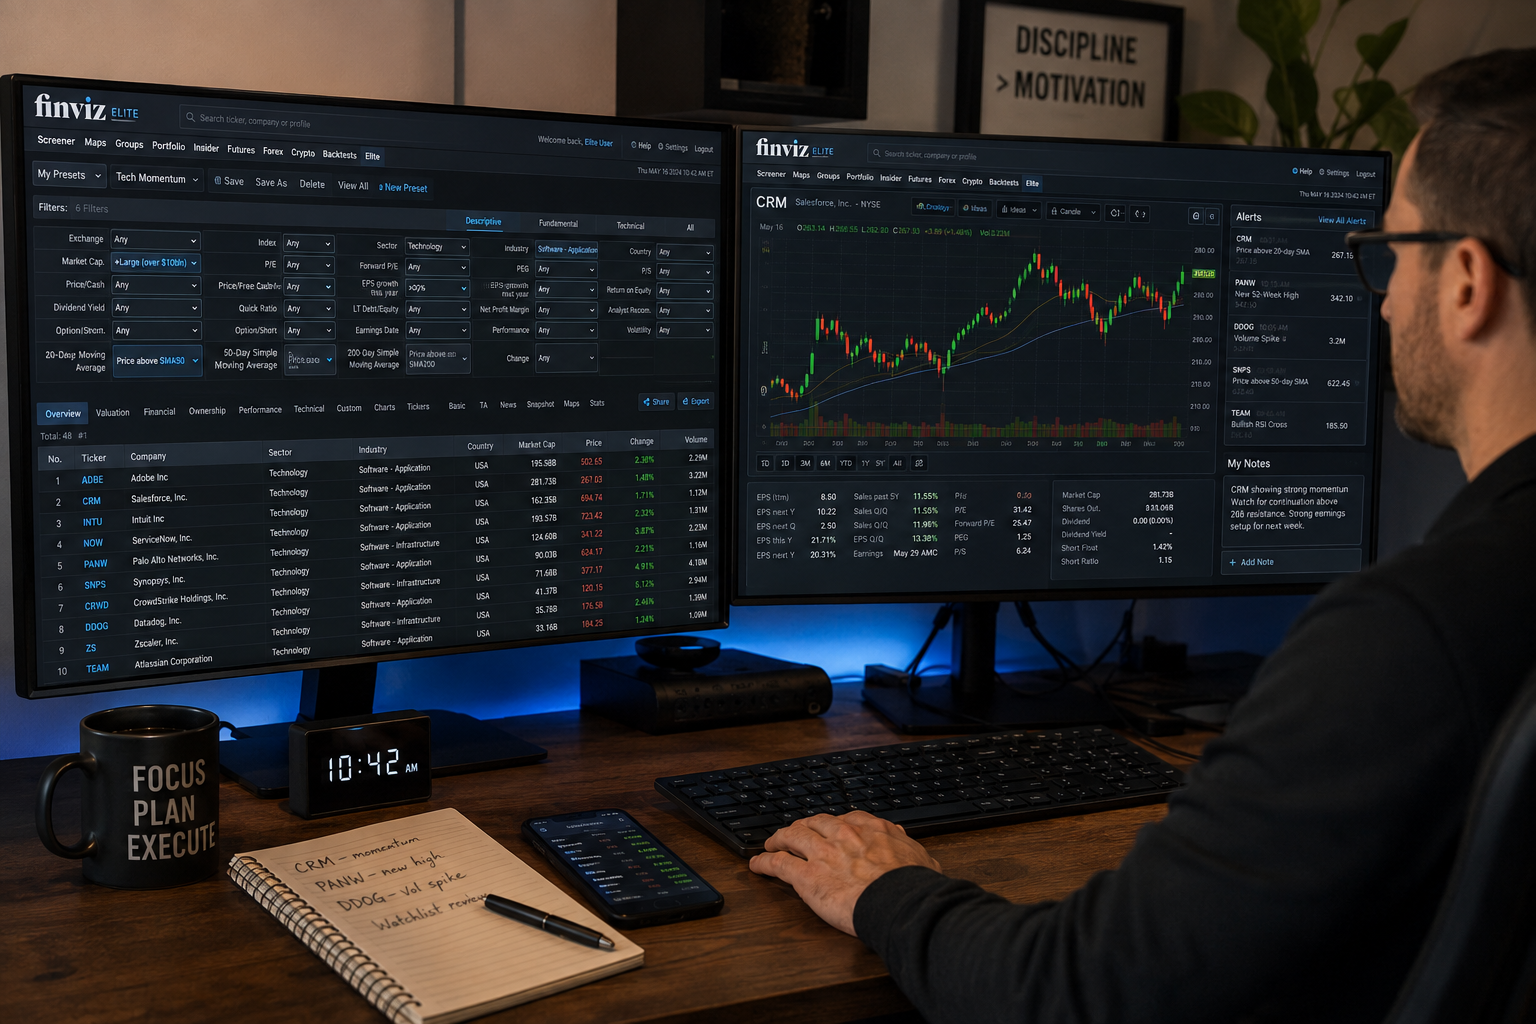
Quick Answer: Finviz is one of the most widely used US stock screeners available, and the free tier is genuinely functional with more than 70 filters. The core limitation is that free quotes run one minute behind the tape and financial statements stop at three years. Finviz Elite fixes both problems for $299.50 a year, and also adds real-time premarket and after-hours data, eight years of statements, Excel export, API access, and unlimited alerts.
Key Takeaways
- Finviz covers NASDAQ, NYSE, and AMEX only. No international markets on any plan.
- Free tier quotes are delayed one minute. Elite quotes are real-time, including premarket from 4 AM and after-hours to 8 PM Eastern.
- Nine filters do the heaviest lifting for active traders: relative volume, float, short float, insider transactions, price vs. moving averages, gap percentage, analyst recommendation changes, sector/industry relative strength, and earnings date proximity.
- Free plan limits you to three years of financial statements. Elite extends that to eight years, which is enough to read a full business cycle.
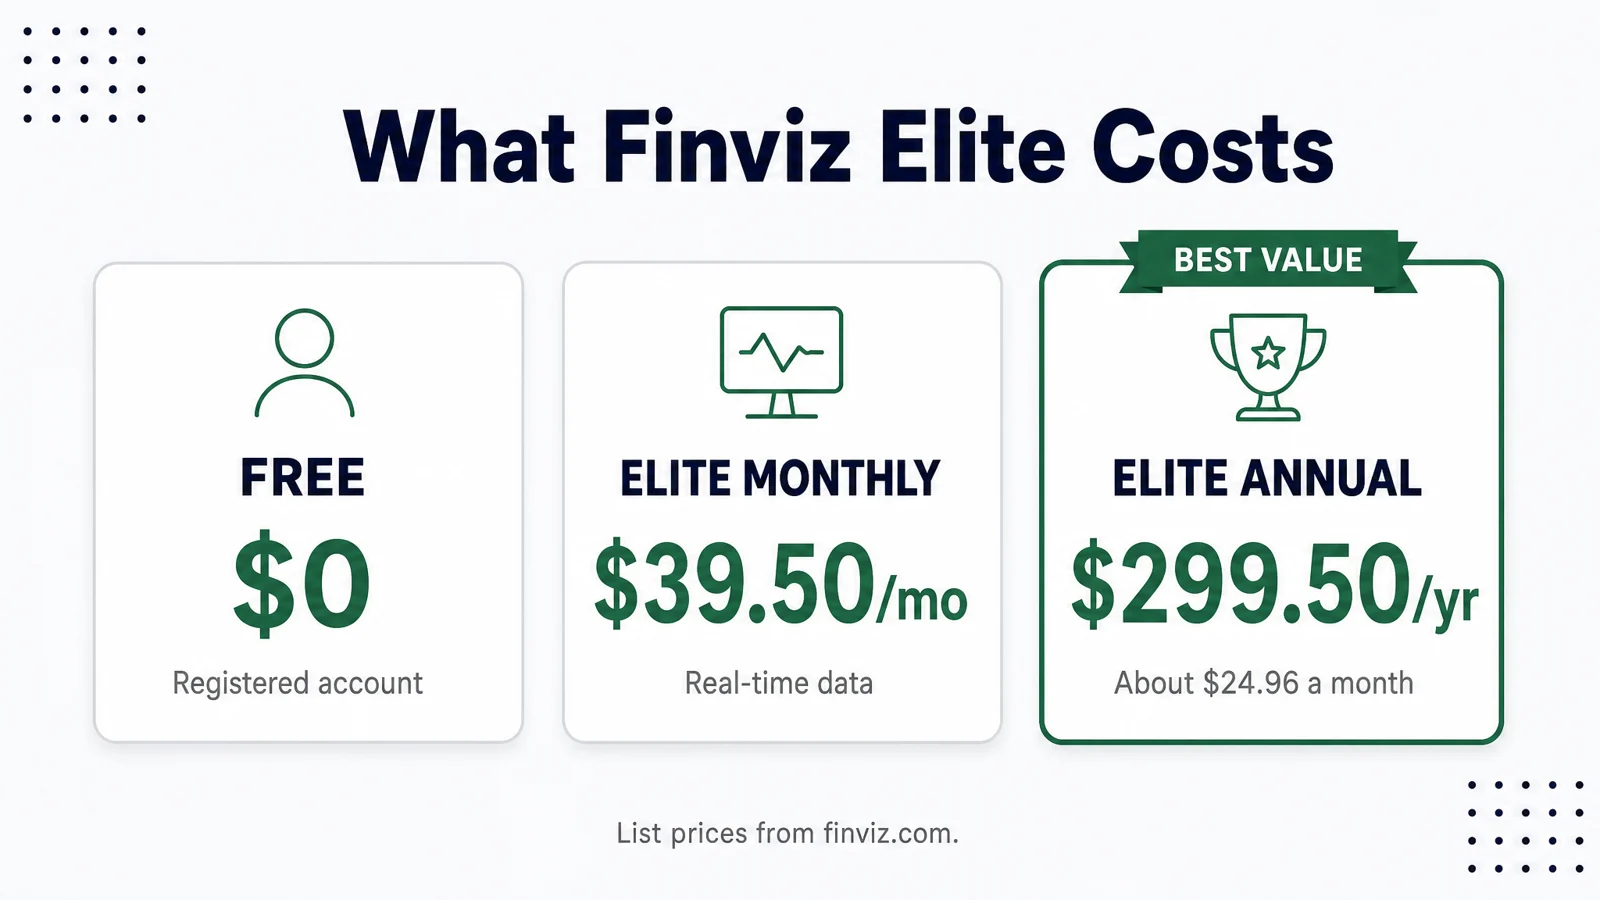
- Elite costs $299.50 per year ($24.96/month) or $39.50 per month on monthly billing. The annual plan saves roughly 37% versus paying month to month.
- A seven-day free trial is available but requires a credit card and converts automatically to a paid plan unless you cancel first.
- Refunds are available on written request within the first 30 days.
- Futures data stays delayed 20 minutes on every plan, including Elite. That is a hard limit, not a tier restriction.
- No backtesting, no broker connection, no options chain analytics beyond the exportable chain.
What the Finviz Stock Screener Actually Does
Finviz is a web-based stock research and screening platform. It lets you filter the US equity universe by more than 70 fundamental and technical criteria, view results as a sortable table or chart grid, and click through to individual ticker pages that combine a chart, key stats, news, insider transactions, and analyst ratings in one place.
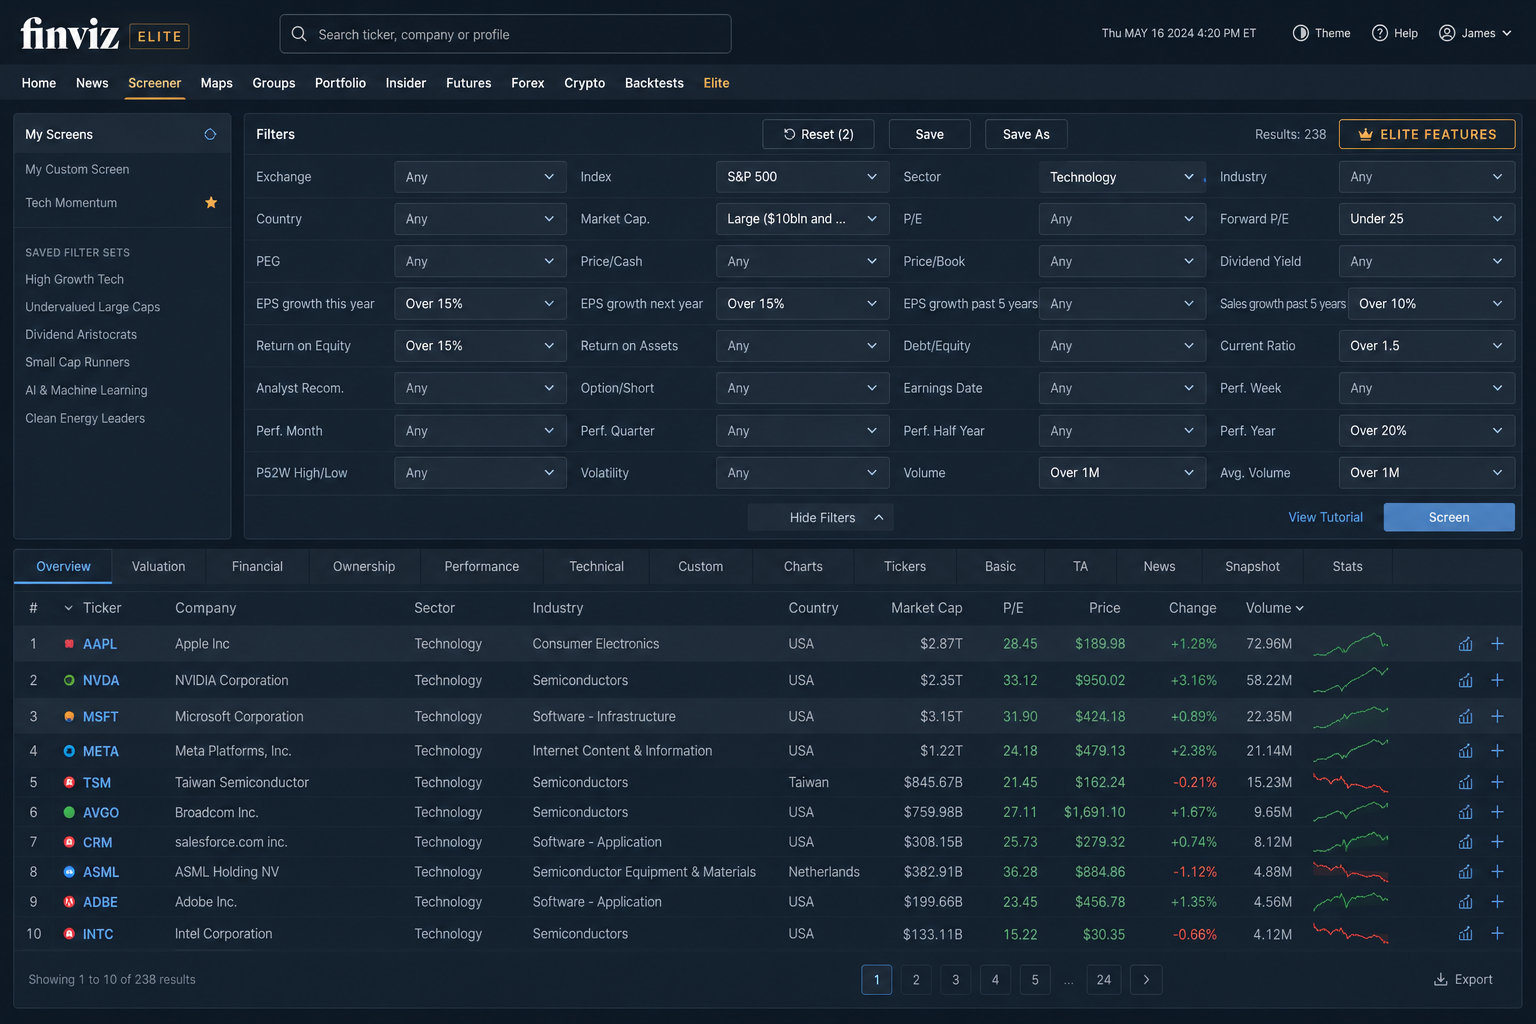
The screener is the main reason most traders show up. You set filters, get a list of tickers that pass, and then dig into the ones that look worth examining. That workflow is fast, the interface loads quickly, and the data coverage is broad enough for most US equity strategies.
Where the Data Comes From and What It Covers
Finviz sources its price data and fundamentals from standard financial data providers. Quote data for NASDAQ, NYSE, and AMEX is delayed one minute on the free plan and real-time on Elite. Financial statement data goes back three years on the free plan and eight years on Elite. News, insider filings, and analyst ratings are pulled from SEC filings and public data sources and appear on individual ticker pages.
The heat map and groups views aggregate performance by sector, industry, and market cap, which gives you a fast read on where money is moving on any given day.
NASDAQ, NYSE and AMEX Only
Every plan, free or Elite, covers only US-listed equities on NASDAQ, NYSE, and AMEX. There is no coverage of international exchanges, no ADR-specific filtering beyond what shows up in the US listing data, and no OTC or pink sheet coverage. If your strategy involves European, Asian, or emerging market stocks, Finviz is not the right tool regardless of which plan you're on.
9 Finviz Screener Filters That Do Real Work
Most of Finviz's 70-plus filters are self-explanatory. These nine are the ones that show up repeatedly in screens that actually generate actionable lists.
1. Relative Volume Against Average Volume
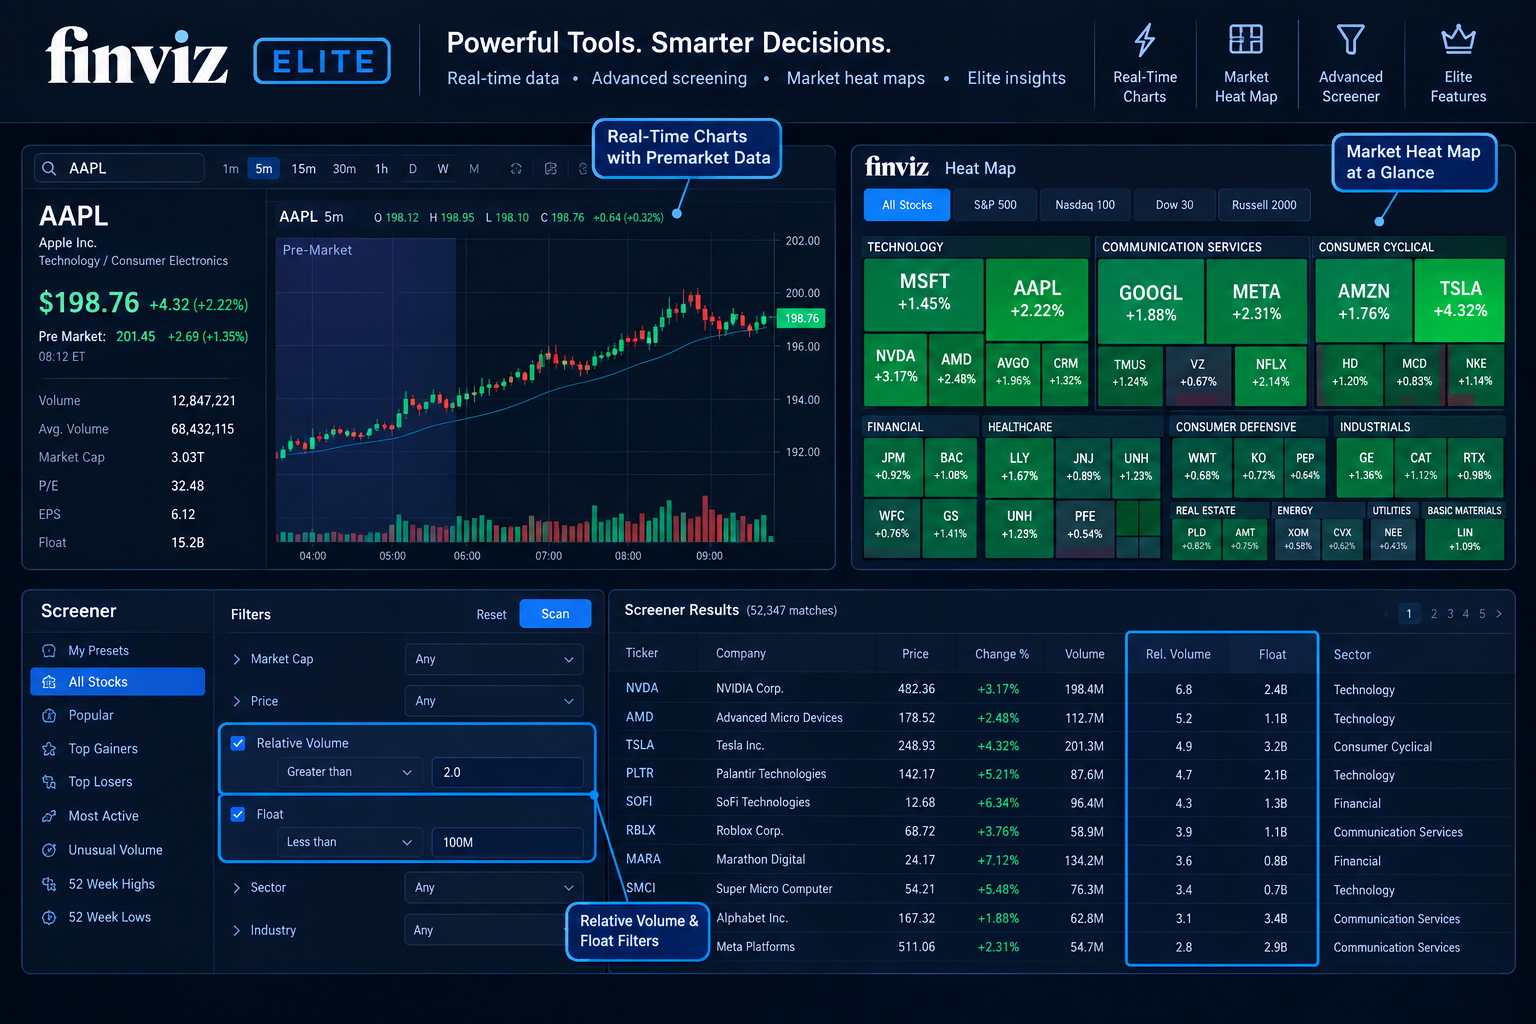
Relative volume (RVOL) compares today's volume so far against the average volume for the same time of day. A stock trading at 3x its normal volume at 10 AM is getting unusual attention. Finviz lets you set a minimum relative volume threshold, so you can screen for stocks where something is actually happening rather than just stocks that happen to be moving.
This is probably the single most useful intraday filter on the platform. Set it to 2 or higher and you cut the universe down to stocks with real participation.
2. Float and Short Float
Float is the number of shares available for public trading. Short float is the percentage of that float currently sold short. Together they tell you a lot about potential volatility.
Low float stocks (under 20 million shares, for example) can move violently on moderate volume because there are fewer shares to absorb buying pressure. High short float stocks above 20% are candidates for short squeezes when buying volume spikes. Finviz lets you filter on both simultaneously, which is how most momentum traders build their initial universe.
3. Insider Transactions and SEC Form 4
The insider transaction filter surfaces stocks where insiders have been buying or selling recently, based on SEC Form 4 filings. Insider buying is generally considered more informative than insider selling, since executives sell for many reasons but tend to buy for only one.
You can filter for positive insider transactions over the past week, month, or quarter. Combine this with a fundamental filter like low P/E or recent earnings beat and you get a list of stocks where the people who know the business best are putting their own money in.
4. Institutional Ownership Change
This filter shows stocks where institutional ownership has increased or decreased over the most recent reporting period. Rising institutional ownership in a stock that's also breaking out technically can confirm that the move has real money behind it. Falling institutional ownership in a deteriorating stock can confirm the other side.
It's a lagging indicator by nature since 13F filings come out quarterly, but it's useful for context when you're evaluating whether a technical setup has fundamental support.
5. Price Against the 20, 50, and 200 Day Moving Averages
Finviz lets you filter by price position relative to the 20-day, 50-day, and 200-day moving averages. You can screen for stocks trading above all three (trending strongly), stocks that just crossed above the 50-day (potential breakout), or stocks below all three (downtrends or potential reversals depending on your strategy).
This is one of the most commonly used filter combinations on the platform. A screen for stocks above the 200-day, above the 50-day, and pulling back to the 20-day gives you a classic trend-continuation setup list in about 15 seconds.
6. Gap Percentage
The gap filter shows stocks that opened significantly above or below their prior close. Filtering for gaps above a certain percentage, say 5% or more, surfaces stocks with overnight catalysts like earnings beats, FDA approvals, or major news events.
This filter is most useful in the first hour of trading when gap-and-go setups are most active. On the free plan, the one-minute delay makes this less useful for intraday decisions. On Elite with real-time data, it's a legitimate part of a morning scan.
7. Analyst Recommendation Change
This filter catches stocks where analyst ratings have changed recently, either upgrades or downgrades. An upgrade from a major firm can drive meaningful volume and price movement, especially in smaller-cap names where institutional coverage is thinner.
Filtering for recent upgrades combined with a price breakout filter gives you stocks that have both technical momentum and fresh analyst attention. It's not a standalone signal, but it adds useful context.
8. Sector and Industry Relative Strength
Finviz's groups view shows performance by sector and industry over multiple timeframes. You can use this to identify which sectors are leading the market and then focus your individual stock screens within those sectors.
Trading strong stocks in strong sectors is a basic principle of momentum investing, and Finviz makes it easy to identify both layers quickly. The heat map view makes the relative strength picture visually obvious in a way that a table doesn't.
9. Earnings Date Proximity
The earnings date filter lets you screen for stocks with earnings coming up within a specific window, say the next week or the next two weeks. This is useful for traders who play pre-earnings momentum or volatility expansion setups.
You can also filter for stocks that just reported earnings, which combined with the gap percentage filter gives you a list of post-earnings movers worth examining.
Building a Screen You Will Actually Reuse
A screener is only as useful as the workflow around it. Here's how to build one that becomes a repeatable part of your process.
Start With Liquidity, Not the Setup
Before you add any technical or fundamental filters, set a minimum average volume (at least 500,000 shares per day is a reasonable floor for most strategies) and a minimum price (above $5 eliminates most low-quality names). These two filters alone cut the universe from thousands of stocks to a few hundred, and everything you look at after that will be tradeable.
Adding setup filters on top of an unfiltered universe means you'll spend time looking at stocks you can't actually trade. Start with liquidity.
Save It as a Preset
Once you've built a screen that works, save it as a preset. Free accounts get 50 presets. Elite accounts get 200. Name them clearly, something like "Momentum Breakout - Above 50MA - RVOL 2x" rather than "Screen 1," and you'll actually use them again.
The preset system is one of the underrated parts of Finviz. Coming back to a saved screen every morning takes about 30 seconds.
Reading Charts View Instead of the Table
The default screener output is a table, which is good for sorting and comparing. But switching to Charts view gives you a thumbnail chart for every ticker in your results, which lets you visually scan 36 charts at once on the free plan (120 on Elite) and immediately eliminate the ones that don't look right.
Most experienced Finviz users spend more time in Charts view than in the table. It's faster for visual pattern recognition than reading numbers in a row.
Finviz Free Against Finviz Elite
The honest way to frame this comparison: free Finviz is a research tool. Elite Finviz is a trading tool. The difference comes down to data timing and depth.
Delayed Quotes Against Real Time
Free plan quotes are delayed one minute on NASDAQ, NYSE, and AMEX. For swing traders doing end-of-day research, one minute doesn't matter. For anyone making intraday decisions, one minute is long enough for a setup to be gone.
Elite delivers real-time quotes and charts, including premarket data from 4 AM to 9:30 AM Eastern and after-hours data from 4 PM to 8 PM Eastern. If you're trading the open or watching for pre-market catalysts, this is the most important upgrade Elite offers.
Three Years of Statements Against Eight
Free accounts see three years of financial statements. That's enough to check recent earnings trends but not enough to evaluate a company through a full economic cycle.
Elite extends statements to eight years. For fundamental analysts looking at how a company performed through 2020, 2022, or any other stress period, eight years of data tells a materially different story than three.
Presets, Rows per Page and Portfolio Caps
Free accounts get 50 presets, 20 table rows or 36 charts per page, and 50 portfolios with 50 tickers each. Elite gets 200 presets, 100 table rows or 120 charts per page, and 100 portfolios with 500 tickers each.
For traders who maintain multiple watchlists and run several different screens, the free plan's caps become friction quickly. The Elite limits are generous enough that most users won't hit them.
Export to Excel and the Finviz API
Free accounts cannot export screener results. Elite adds Excel export and a full API covering the Screener, Portfolio, Groups, Options Chain, and News endpoints. Sample code is provided for Google Sheets, Python, and JavaScript.
For traders who want to do additional analysis outside Finviz, build custom dashboards, or feed screener results into other tools, the API is a significant addition. It's also the feature that makes Finviz Elite relevant to quant-leaning retail traders who want to automate their morning scan. If you're exploring how AI tools can layer on top of screener data, the AI trading platforms category has grown considerably around exactly this kind of workflow.
Finviz Elite Cost: What the Annual Plan Buys
Finviz Elite costs $39.50 per month on monthly billing or $299.50 per year on annual billing, which works out to $24.96 per month. The annual plan costs about 37% less per month than monthly billing.
Monthly Against Annual Billing
Monthly billing makes sense if you want to try Elite for a month or two before committing, or if your trading is seasonal and you only need real-time data part of the year. Annual billing makes sense if you're an active trader who screens stocks regularly. At $299.50 per year, Elite costs less than $25 per month, which is a reasonable cost for a tool you use every trading day.
The Seven Day Trial and the Card It Requires
The seven-day free trial gives you full Elite access at no charge, but it requires a credit card and converts automatically to a paid plan at the end of the trial period unless you cancel first. Set a calendar reminder on day five if you're not sure you want to keep it.
The Thirty Day Refund Window
Finviz offers refunds on written request within the first 30 days of a paid subscription. This is a meaningful safety net. If you subscribe, use it for a few weeks, and decide it's not right for your workflow, you can get your money back. The refund window applies to the paid subscription, not the trial period.
Comparison Table: Finviz Free, Finviz Elite, TradingView, and Trade Ideas
| Feature | Finviz Free | Finviz Elite | TradingView | Trade Ideas |
|---|---|---|---|---|
| Quote delay | 1 minute | Real-time | Real-time (paid) | Real-time |
| Premarket/AH data | No | Yes (4 AM, 8 PM ET) | Yes (paid) | Yes |
| Financial statements | 3 years | 8 years | Limited | No |
| Screener filters | 70+ | 70+ plus custom | Moderate | Extensive |
| Excel export | No | Yes | Limited | Yes |
| API access | No | Yes | Yes (paid) | Yes |
| Backtesting | No | No | Yes (paid) | Yes |
| Broker connection | No | No | Yes (some brokers) | Yes |
| International markets | No | No | Yes | No |
| Price (annual) | Free | $299.50/yr | $155.88,$599.88/yr | ~$1,188/yr |
| Alerts | No | Yes (unlimited) | Yes (limited free) | Yes |
TradingView and Trade Ideas pricing based on publicly listed plans. Verify current pricing directly with each provider.
Pros and Cons of Finviz Elite
What works well:
- The free screener is genuinely useful and costs nothing. Most traders can start here and decide later whether Elite is worth it.
- Real-time quotes plus premarket and after-hours coverage make Elite a legitimate intraday tool, not just an end-of-day research tool.
- Eight years of financial statements is enough to evaluate a company through multiple market cycles.
- The API with sample code for Python, Google Sheets, and JavaScript is a real feature for traders who want to automate their workflow. For context on how traders are building these kinds of hybrid setups, the 7 AI tools swing traders are using to catch moves before everyone else piece covers some of the adjacent tooling.
- Complete ETF holdings breakdowns rather than just the top 10 positions.
- The ad-free interface on Elite is a bigger quality-of-life improvement than it sounds. The free plan has enough ads that they genuinely interrupt the workflow.
- The 30-day refund window removes most of the financial risk from trying it.
What could be better:
- US markets only. If you trade internationally, Finviz is not the right screener regardless of which plan you're on.
- Futures data is delayed 20 minutes on every plan, including Elite. This is a hard limit and Finviz is transparent about it, but it's worth knowing before you subscribe.
- The free plan's one-minute delay rules out any intraday use case.
- Three years of statements on the free plan is genuinely limiting for fundamental analysis.
- No backtesting engine. You can screen for setups but you cannot test whether those setups have historically worked.
- No broker connection. Finviz is a research tool, not an execution tool.
- Charting is functional but not deep. If advanced charting with custom indicators is your priority, TradingView is better suited for that specific need.
- Monthly billing at $39.50 costs about 58% more per month than the annual plan. There's a strong financial case for committing to annual if you're going to use it consistently.
5 Things Finviz Will Not Do
No Options Chain Analytics
Finviz Elite includes an exportable options chain as part of its API, but there is no built-in options analytics interface. You cannot screen by implied volatility rank, options volume, put/call ratio, or unusual options activity within Finviz itself. If options flow is central to your strategy, you'll need a dedicated options tool alongside Finviz. The AI options tools category covers several platforms built specifically for that workflow.
Futures Stay Delayed Twenty Minutes on Every Plan
Futures data on Finviz is delayed 20 minutes on both the free plan and Elite. This is not a tier restriction that Elite removes. It is a permanent limitation of the platform. If you need real-time futures data, you need a different data source.
No International Markets
Finviz covers NASDAQ, NYSE, and AMEX only. There is no coverage of London, Frankfurt, Tokyo, Hong Kong, or any other international exchange. There is no plan or upgrade path that adds international coverage.
No Backtesting
You can build a screen in Finviz and see which stocks currently pass it, but you cannot run that screen historically to see how many of those setups led to profitable trades. There is no backtesting engine. For traders who want to validate their screening criteria before committing capital, this is a genuine gap.
No Broker Connection
Finviz has no integration with any brokerage. You cannot route orders, set stop losses, or manage positions from within the platform. It is a research and screening tool only.
Finviz Apps and Mobile: What You Get on a Phone
Finviz does not have a dedicated mobile app on iOS or Android. The website is accessible on mobile browsers and is reasonably functional for checking individual tickers, viewing the heat map, and browsing screener results. But the screener itself, with its filter panel and results table, is designed for a desktop experience and feels cramped on a phone screen.
Most active users treat Finviz as a desktop tool and use their broker's mobile app for execution and position monitoring. If mobile-first screening is important to your workflow, this is worth factoring into your decision.
Who Should Pay for Elite and Who Should Stay Free
Pay for Elite if:
- You make intraday decisions and need real-time quotes. The one-minute delay on the free plan is a dealbreaker for anything time-sensitive.
- You do fundamental analysis and need more than three years of financial statements to evaluate a company properly.
- You want to automate your morning scan or feed screener results into other tools. The API is the only way to do that.
- You run multiple watchlists and screens and keep hitting the free plan's preset and portfolio caps.
- You want premarket and after-hours data as part of your regular workflow.
- You're already using Finviz free every day. At $24.96 per month on annual billing, the upgrade cost is low relative to the data improvements.
Stay on the free plan if:
- You're a swing or position trader who does all your research after the close. One-minute-delayed end-of-day data is fine for that workflow.
- You're newer to screening and still figuring out which filters matter for your strategy. The free plan has everything you need to learn the tool.
- You primarily use another platform for charting and just use Finviz occasionally for a quick scan. Paying for Elite on an occasional-use basis doesn't make economic sense.
- Your strategy requires international markets, backtesting, or broker integration. Elite doesn't add any of those capabilities.
For traders who are actively building out their toolkit and want to see how screener data fits alongside AI-assisted analysis, the AI stock screeners vs. the old filters you're still wasting time on piece is worth reading alongside this review.
How to Get the Best Deal
The annual plan at $299.50 is the straightforward answer. It's the lowest per-month cost available and there's no promotional pricing or coupon system that changes that math.
The seven-day trial is the right starting point if you haven't used Elite before. Use the trial to run your actual screens with real-time data, check the API documentation if that's relevant to you, and verify that the eight-year statement data covers the history you need. If it works for your workflow, let the trial convert to the annual plan. If not, cancel before day seven.
The 30-day refund window on written request means that even if you forget to cancel the trial and it converts to a paid plan, you have a month to evaluate it and request a refund if it's not right.
Final Verdict: Where Finviz Elite Earns the Subscription
Finviz free is one of the most useful no-cost tools in retail trading. The screener works, the heat maps are genuinely informative, and the individual ticker pages pack a lot of data into a clean layout. For end-of-day research and learning how to screen, the free plan is hard to beat.
The case for Elite comes down to three things: real-time data, deeper financials, and the API. If you're making any intraday decisions, the one-minute delay on the free plan is a real problem and Elite solves it cleanly. If you're doing serious fundamental analysis, three years of statements isn't enough and eight years is. If you want to automate your screening workflow or feed results into other tools, the API is the only path.
At $299.50 per year, Elite is priced reasonably for what it delivers. It's not a charting platform and it's not a backtesting engine, and if those are your priorities you'll need to supplement it. But as a US equity screener with real-time data, broad filter coverage, and a functional API, it does its job well and the annual cost is low enough that it pays for itself quickly for anyone who screens stocks regularly.
The seven-day trial with a 30-day refund window means the financial risk of trying it is minimal. If you're already using Finviz free on a daily basis, the upgrade is worth testing.
Related reading:
We test the tools. You get the verdict.
One email a week. What we tested, what scored, and what we'd skip. Written for traders, not for clicks.
Frequently asked
Topics in this teardown
Our verdict on Finviz Elite
Finviz Elite scores 90 on two perfect pillars.