
FullStack Alpha
Review
FAST Graphs logo

FAST Graphs Review

One chart that answers one question, and dividend investors have argued about its price for fifteen years.

Listen to this review
Audio in production

What FAST Graphs Actually Looks Like

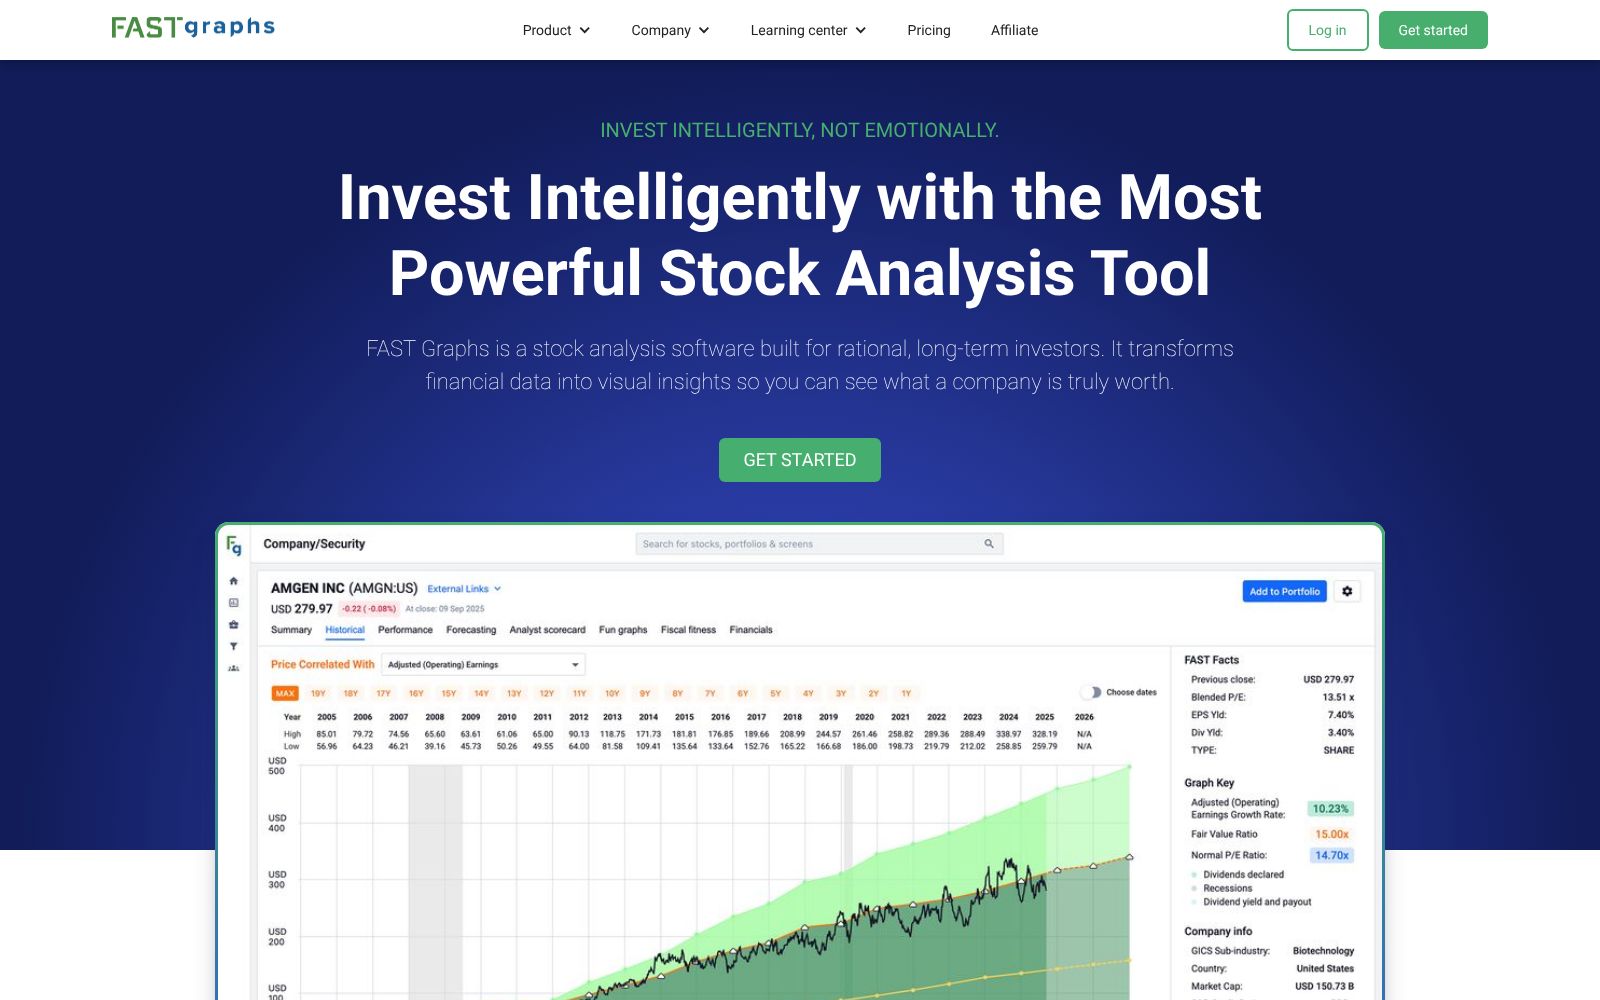
Screenshot of the FAST Graphs homepage
The FAST Graphs homepage
Editorial Deep Dive

FAST Graphs Review 2026: Is Mr. Valuation's Tool Worth the Price?

Fast Graphs review 2026: pricing, fair value charts, backtesting, integrations, and an honest Alpha Score of 74/100 for dividend and value investors.

Read the full FAST Graphs teardown
  • Length5,300 words
  • Read time24 min
  • RefreshedEvery 6 to 12 months

The Verdict

FAST Graphs does a single thing: it overlays price against earnings, cash flow and dividends so you can see in one glance whether a company is trading above or below what its own history says it is worth. For dividend and value investors that one chart replaces an hour of spreadsheet work, and long-term users in r/dividends say it has mainly stopped them overpaying — which is a real edge, if an unglamorous one. Two honest limits. The forward portion of the chart rests on analyst estimates, and those are frequently wrong. And at $191 to $480 a year, the cost is a meaningful share of returns on a small portfolio, which is why the recurring question in every thread is not whether it works but whether it is worth it at your account size.

The Watch-Out

There is no permanent free tier. The 7-day trial takes no credit card, which is fair, but after it you pay or you leave. The fine print also reads that all plans renew annually at list price, so a promotional entry rate is not guaranteed to carry into year two. Paying monthly costs roughly 25% more than annual on both tiers. And the published annual lump sums do not exist — the page shows only per-month figures for annual billing, so $191.40 and $480 are our arithmetic, not FAST Graphs' stated price.

Who It's For

Hover, tap, or focus a card to see who we'd point at this tool — and who should walk away.

Who this is for

The traders who get the most out of FAST Graphs.

Flip to see the list

Who this is for

  • Dividend and value investors deciding whether a quality company is currently expensive
  • Anyone who wants valuation context in one chart instead of a spreadsheet
  • Investors with enough capital that $191 to $480 a year is a rounding error, not a drag

Who this isn't for

Where FAST Graphs is the wrong spend.

Flip to see the list

Who this isn't for

  • Small portfolios where the subscription is a visible share of annual returns
  • Traders — this is a valuation tool on a multi-year horizon
  • Anyone allergic to analyst estimates, since the forward view depends on them

The Pain It Solves

A real complaint from the trading forums, and what this tool actually does about it.

—
r/dividends
“Also fast graphs relies on analyst estimates, that are completely wrong most of the time. Your biggest goal should be to increase your income. This has the most impact. Not stock picking.”

Source: r/dividends

FAST Graphs logo

FAST Graphs

That is the right criticism and it points at how to use the tool. The orange earnings line behind the price is history and it is not an estimate — that part is solid. The forecast section to the right of today is analyst consensus and it deserves the skepticism. Read the historical relationship between price and earnings, which is what FAST Graphs is genuinely good at, and treat the forward projection as one scenario rather than a target. Used that way the estimate problem mostly disappears.

What Users Say

Sentiment pulled from one independent source, kept separate so you can weigh each one yourself.

Reddit logor/dividendsReddit
“I have been using Fast Graphs for a few years. It really helps keep you overpaying for stocks. I often wonder if I made more money buying when stocks when they get to fair value or not having lost money buying them when they are too expensive. It has really been a very helpful investment tool.”
Read the original on Reddit →
Reddit logor/SecurityAnalysisReddit
“Thanks guys for the insight. I'm still questioning if its truely worth the money. Unless you have a lot in the market $400-$500 is a lot to spend per year on a tool like that.”
Read the original on Reddit →
Reddit logor/dividendsReddit
“I have used FastGraphs for years ... since it was created actually. Another thing I would like to point out about JNJ is the earnings consistency ... the earnings (orange line) is just up to the right ... only ONE YEAR in the last TWENTY where earnings went down! Fantastic! Also, look at the analyst scorecard in FastGraphs ... it tells you how reliable the future earnings estimates are.”
Read the original on Reddit →
Reddit logor/dividendsReddit
“I wish I could afford Fast Graphs. Services like that seem to eat away at profits.”
Read the original on Reddit →
Reddit logor/dividendsReddit
“Fastgraphs is 100% worth the money, that being said why don't you like to read the articles on seeking alpha? Also would consider Valueline if you don't want to read quarterly reports”
Read the original on Reddit →

Every quote is real and traceable. How we source them →

Pricing

Free trial

$0 for 7 days

Full-feature access including 8 valuation metrics and unlimited basic portfolios. No credit card required to start.

Basic

$19.95 / month, or $15.95 / month billed annually

Research terminal, summary page, historical and performance charts, forecasting calculators, FUN Graphs and financials. Capped at 5 valuation metrics and 3 basic portfolios.

Our pick

Premium

$49.95 / month, or $40.00 / month billed annually

Everything in Basic with 8 valuation metrics and unlimited basic portfolios. The top published tier — there is nothing above it.

Prices change. Check the vendor’s page before you buy.

Pros and Cons

What works

  • The earnings-and-price overlay is the clearest valuation-in-one-picture tool available
  • Long-term users credit it specifically with keeping them from overpaying, which is the job
  • 7-day full-feature trial with no credit card required
  • Cancel any time with access through the end of the billing period, and prorated upgrades
  • Basic at $15.95 a month annually is the cheapest entry into this category

What doesn’t

  • The forward view depends on analyst estimates, which users correctly note are often wrong
  • No permanent free tier — 7 days, then you pay
  • Monthly billing costs about 25% more than annual on both plans
  • Annual lump sums are not published; only per-month annual-equivalent figures are shown
  • The fine print says all plans renew annually at list price, so intro rates may not persist
  • Basic caps you at 5 valuation metrics and 3 portfolios against Premium's 8 and unlimited

FAST Graphs FAQ

The Alpha Report

We test the tools. You get the verdict.

One email a week. What we tested, what scored, and what we'd skip. Written for traders, not for clicks.

No spam. Unsubscribe anytime.

Related Reading