

FAST Graphs Review 2026: Is Mr. Valuation's Tool Worth the Price?
Short on time? The FAST Graphs Alpha Score scorecard covers pricing, the verdict and what traders actually say, in about 90 seconds.
See the score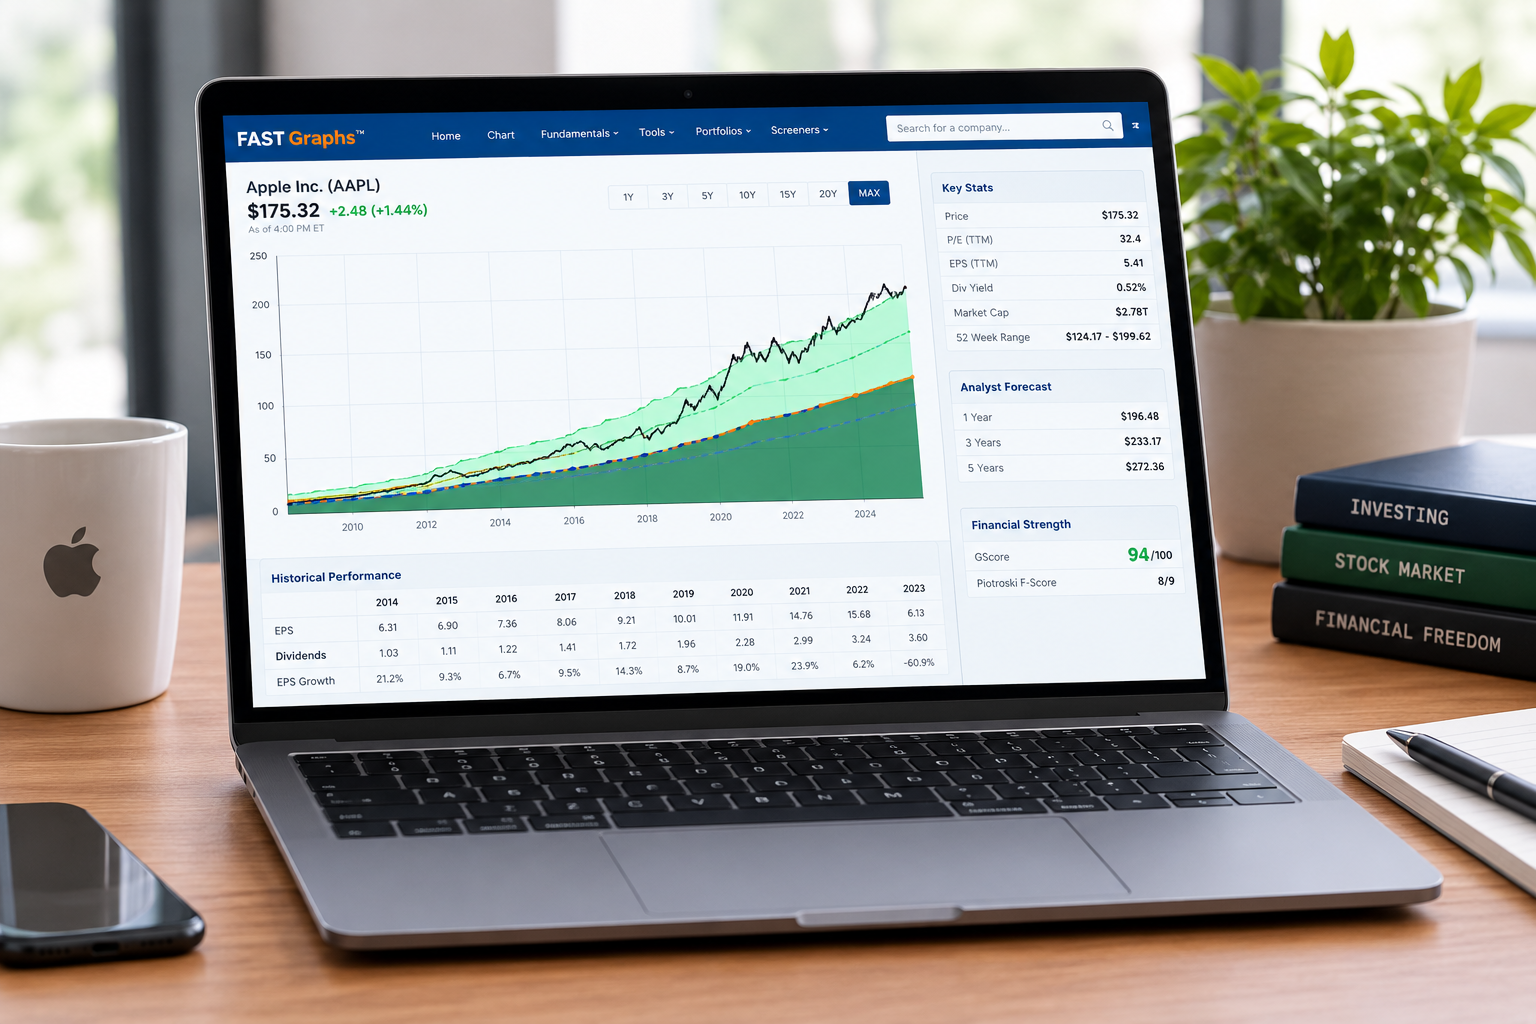
Quick answer
Fast graphs review verdict: Chuck Carnevale's valuation tool earns a 74/100 Alpha Score, desk-researched and last tested September 21, 2026. It's the cleanest way to see if a quality stock is priced for a fair return, but the $49.95-a-month Premium tier and the missing mobile app will test how much you value the workflow over the wallet.
FAST Graphs isn't a stock picker and it isn't a screener that spits out buy signals. It's a valuation lens. You bring the company, it shows you the price history against the earnings, and you decide. That distinction matters more than any feature on the list, and we'll come back to it.
FAST Graphs review: key takeaways
- Founded in 1992 by Chuck Carnevale ("Mr. Valuation") and programmer Tim Loudin, running on the same core valuation logic for over three decades.
- FastGraphs.com confirms FactSet data has powered the platform since 2019, replacing an earlier data provider.
- Basic runs $19.95 a month or $15.95 a month billed annually ($191.40 a year). Premium runs $49.95 a month or $40 a month billed annually ($480 a year).
- Annual billing saves roughly 17% to 20% on either tier, per FastGraphs.com pricing pages.
- A 7-day free trial is available for new subscribers, and the main pricing page doesn't require a credit card to start.
- FAST Graphs has no iOS or Android app. It's a web platform, full stop.
- Alpha Score: 74/100, built from Signal Quality (17/20), Transparency (18/20), Price-to-Value (12/20), Usability (14/20), and Community Verdict (13/20).
What does FAST Graphs actually do?
Every FAST Graphs review should start with the one chart the whole product is built around.
FAST Graphs plots a company's earnings, price, and (on Premium) cash flow and sales on one chart so you can see in seconds whether the stock is trading above or below its own historical valuation. The core visual is the earnings-and-price correlated graph, and the whole platform is built around one orange line.
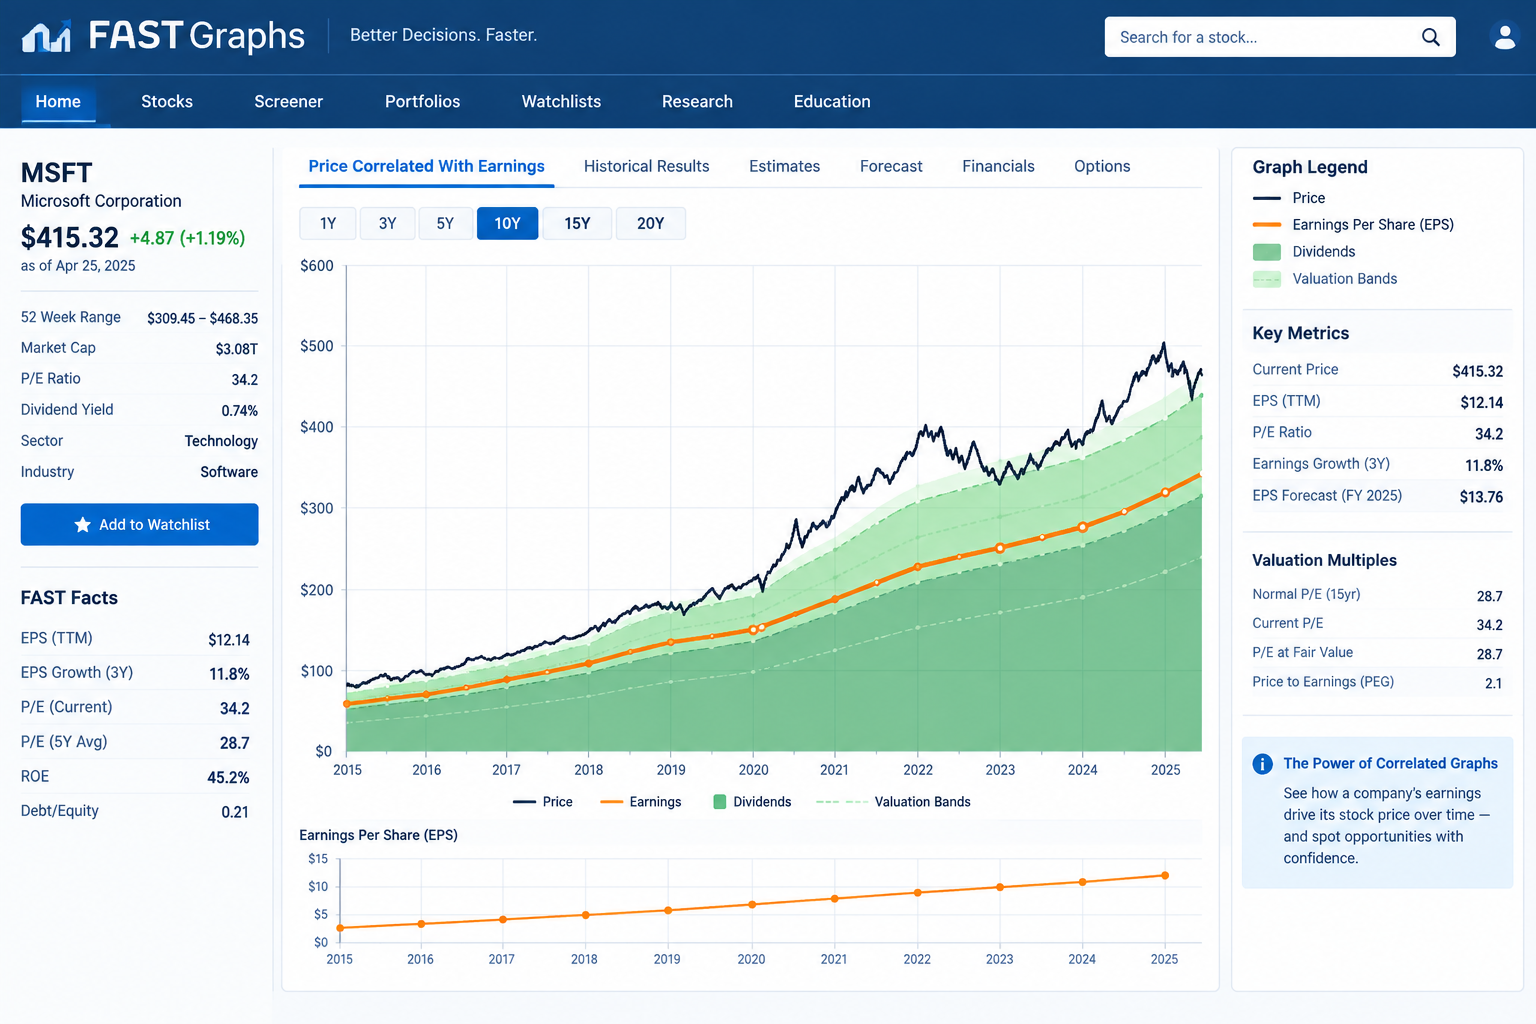
That orange line represents the company's earnings per share, stretched across 20 years of history plus analyst estimates for the next few years. A black line tracks the actual stock price on top of it. When the black price line sits above the orange earnings line, the stock is trading rich relative to its own history. When it dips below, you're looking at a company priced cheaper than its earnings would justify.
The benefit is simple: you stop guessing whether "expensive" means expensive. Most investors eyeball a 52-week chart and call a stock cheap because it dropped 20%. FAST Graphs asks a better question: cheap relative to what the business is actually earning, not cheap relative to last month's price.
Here's how the core features translate into something you'd actually use:
- The earnings-and-price graph shows you, in one glance, whether you'd be buying a quality company on sale or paying a premium for a good story. That's the difference between a value investor and someone who read a headline.
- The FG Score rates a company's fundamental quality: things like earnings consistency, dividend safety, and debt levels rolled into one number, so you're not eyeballing five different ratios before you even get to the valuation question.
- The screener filters the FactSet-covered universe by growth rate, yield, sector, and valuation, which matters if you're building a watchlist instead of researching one ticker at a time. It's Premium-only.
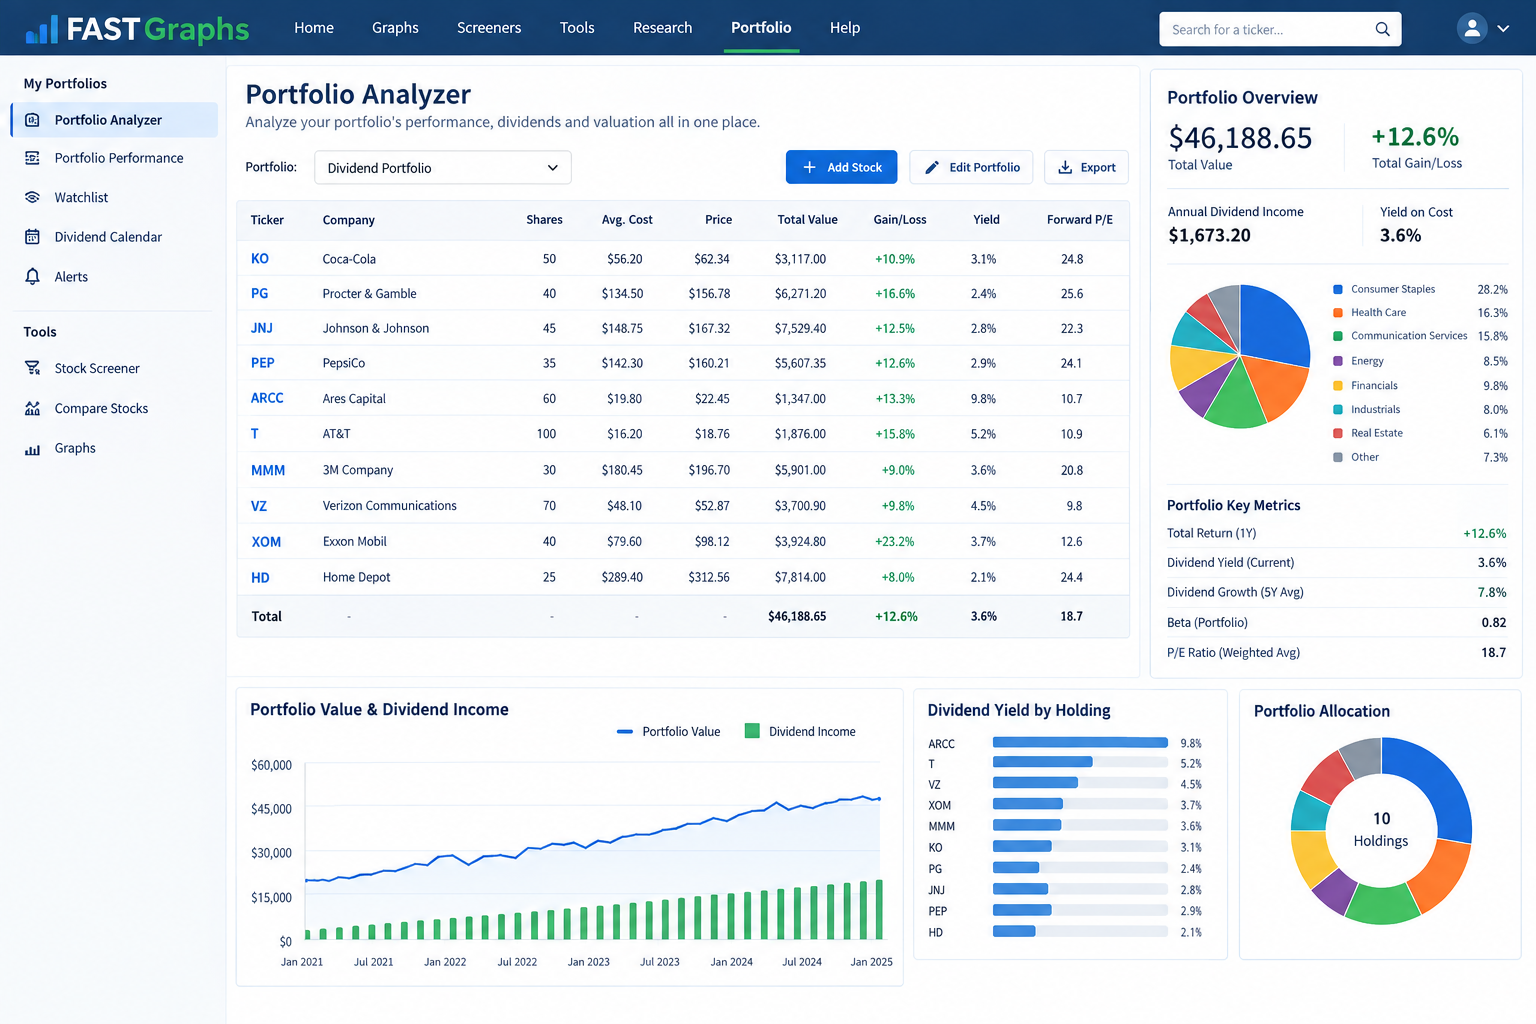
- Portfolio Analyzer links your actual holdings, or a broker-connected account on Premium, to the same valuation charts, so your existing portfolio gets the same fair-value scrutiny as a new idea.
If you're a dividend growth or value investor, the pitch here writes itself: you're not trying to time the market, you're trying to avoid overpaying for a business you plan to own for a decade. That's a fundamentally different job than chart-pattern trading, and FAST Graphs is built for exactly one of those jobs. If you came here looking for a breakout scanner or an entry-and-exit signal for a swing trade, you're in the wrong store. Our guide to AI stock screeners covers tools built for that job instead.
How does the fair value chart work?
This is the part of a FAST Graphs review that pays for itself, because the chart only helps if you can read it.
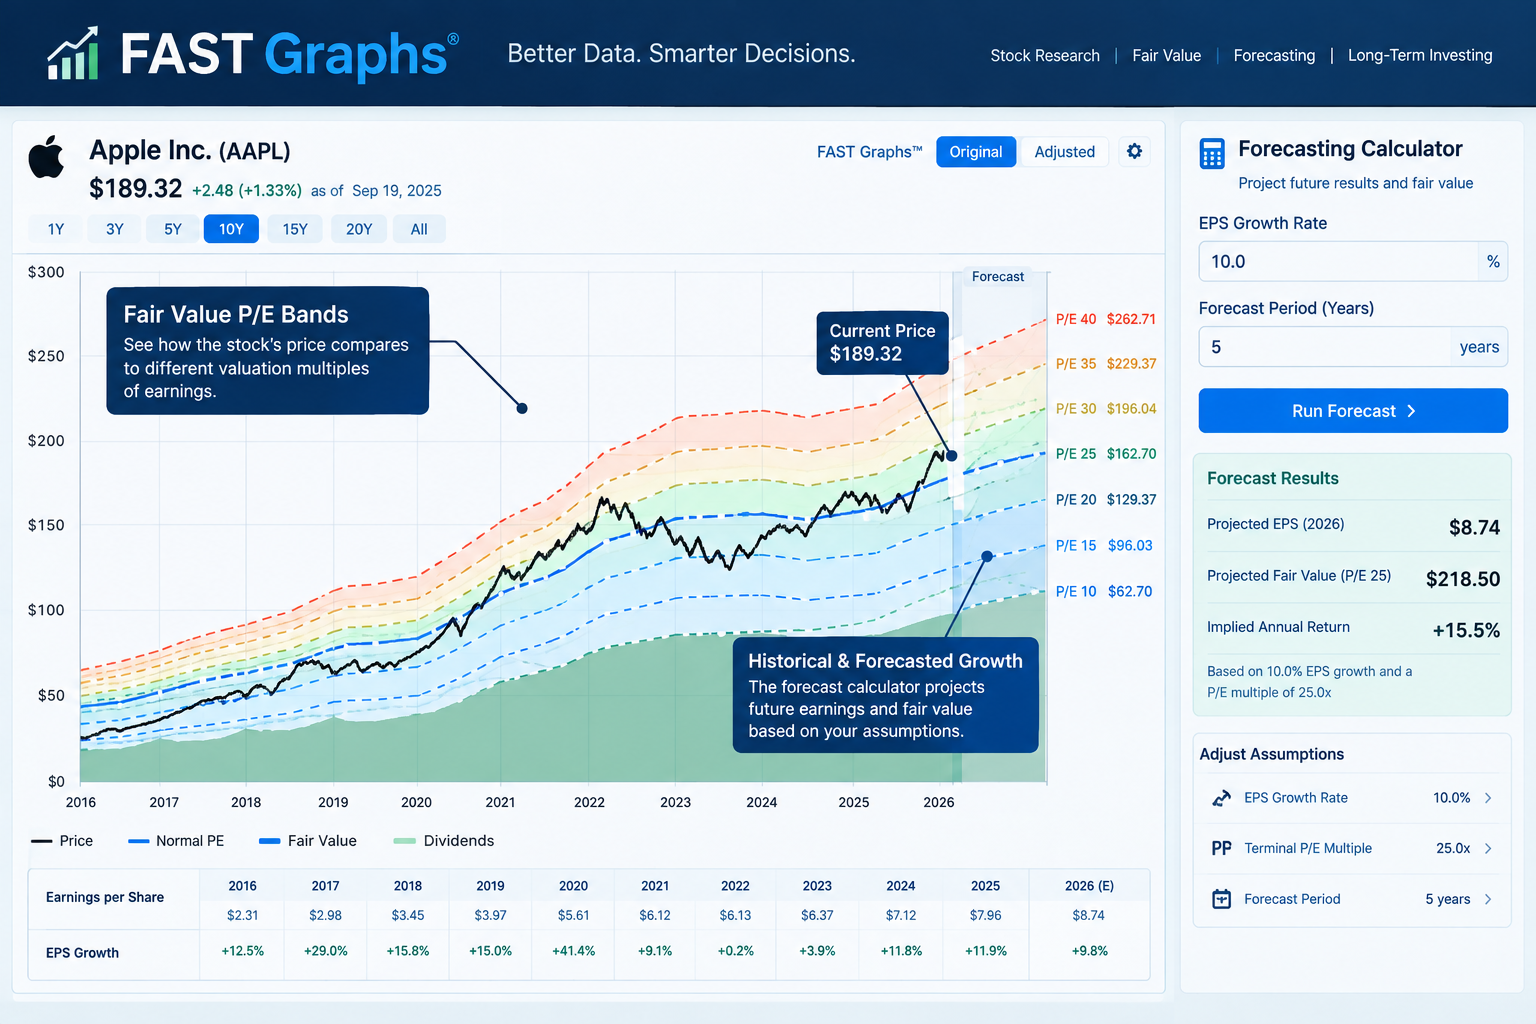
FAST Graphs calculates fair value using a blended P/E ratio, typically the stock's own 15-year average multiple, and plots that as a shaded band against the earnings line so you can see how far current price sits from historical norms. It's a valuation method, not a prediction engine.
P/E, quick refresher: the price-to-earnings ratio is what the market is willing to pay for one dollar of a company's annual profit. A stock trading at 25 times earnings costs more per dollar of profit than one trading at 15 times, all else equal. FAST Graphs doesn't invent a magic multiple. It uses the company's own historical average, which is a more honest anchor than comparing, say, a utility to a software company on the same scale.
The blended P/E line smooths that historical multiple against forward estimates, so the fair value band adjusts as new analyst forecasts roll in instead of staying frozen on last year's numbers.
Two tools do the heavy lifting past the chart itself:
- Forecasting calculators let you plug in your own growth assumption, say 8% earnings growth over five years, and see what total return that implies if the stock reverts to its historical valuation. This turns a hunch ("I think this company keeps growing") into a number you can argue with, including yourself.
- The FG Score adds a quality layer on top of the price question, because a cheap stock attached to a deteriorating business isn't a bargain. It's a value trap with better marketing.
Decision rule: if the price line is sitting meaningfully below the shaded fair value band and the FG Score is solid, that's the setup FAST Graphs is built to flag. If the price line is above the band, you're not necessarily wrong to buy, but you're paying above what the company's own history says the market usually pays for it. That's a fact worth knowing before you click buy, not after.
Common mistake: treating the fair value band as a ceiling or floor the stock "has to" respect. It's a historical average, not a law of physics. A company can trade above its 15-year average P/E for good reason (higher growth, lower rates, a re-rating) or below it for a bad one (declining moat, accounting concerns). The chart tells you where the price sits relative to history. It doesn't tell you why, and it doesn't tell you what happens next.
Has FAST Graphs been backtested?
A FAST Graphs review that quotes a backtested return is inventing one. Here is what the tool actually proves.
FAST Graphs isn't sold as a backtested trading signal, and it shouldn't be judged as one. It's a valuation lens with an analyst scorecard that shows how reliable past earnings estimates have actually been for a given company, which is a different and often more useful thing than a hypothetical return backtest.
Here's the distinction that matters: a lot of tools in this category run a backtest, get a flattering number, and market that number like it's a promise. FAST Graphs doesn't do that, and to its credit, Chuck Carnevale has spent years on public webinars and in FAST Graphs' own materials warning people not to treat the tool as a crystal ball.
The analyst scorecard is the more honest substitute. It tracks how close Wall Street's consensus earnings estimates for a given company came to what actually happened, historically. If analysts have been consistently too optimistic about a company's growth, the scorecard shows it, and you can discount the forward fair-value band accordingly. Most valuation tools hide this. FAST Graphs puts it right in front of you.
Why this matters for a dividend or value investor: your return estimate is only as good as the growth assumption behind it. A forecasting calculator that lets you plug in 12% growth for a company that's missed every estimate for three years is a tool that will happily help you fool yourself with high confidence. The scorecard is the check on that. Process over prediction, in practice, means checking whether the forecast has earned your trust before you build a thesis on top of it.
We're not going to invent a win rate or an average annualized return for FAST Graphs users, because FAST Graphs doesn't publish one and it shouldn't. Any tool in this space claiming a specific backtested return on your investment decisions is selling you a story, not a method.
What does FAST Graphs integrate with?
Integrations are the weak spot most FAST Graphs review pieces skip, so they get a straight answer here.
FAST Graphs runs on FactSet data covering US, Canadian, and (with the international add-on) roughly 80,000 additional global symbols, and it connects your real brokerage holdings through the Portfolio Analyzer, but only on the Premium tier and only through the web.
The integration list is short by design:
- FactSet supplies the fundamental data (earnings, cash flow, sales, analyst estimates) that every chart is built on. FactSet is an institutional-grade data provider, the same category used by professional analysts, which is a meaningful upgrade in data quality over some free tools scraping public filings.
- Portfolio Analyzer with broker connections (Premium only) pulls your actual holdings into the platform so every position in your account gets the same fair-value treatment as a new research idea. That's genuinely useful if you manage a real dividend portfolio and want a standing check on whether your winners have run past fair value.
- Web only. There is no FAST Graphs app for iOS or Android. You get the full platform through a browser, on desktop or mobile browser, but not a native app experience.
The no-app gap is a real one for this audience. If you're used to checking your portfolio from your phone during a coffee break, you're opening a mobile browser and squinting at a desktop-style interface, not tapping an app icon. For a subscription in this price range, that's a fair ding, and we'll score it that way below.
How much does FAST Graphs cost, and which tier makes sense?
Pricing is where a FAST Graphs review earns its keep, so the tiers below were checked on the day of writing.
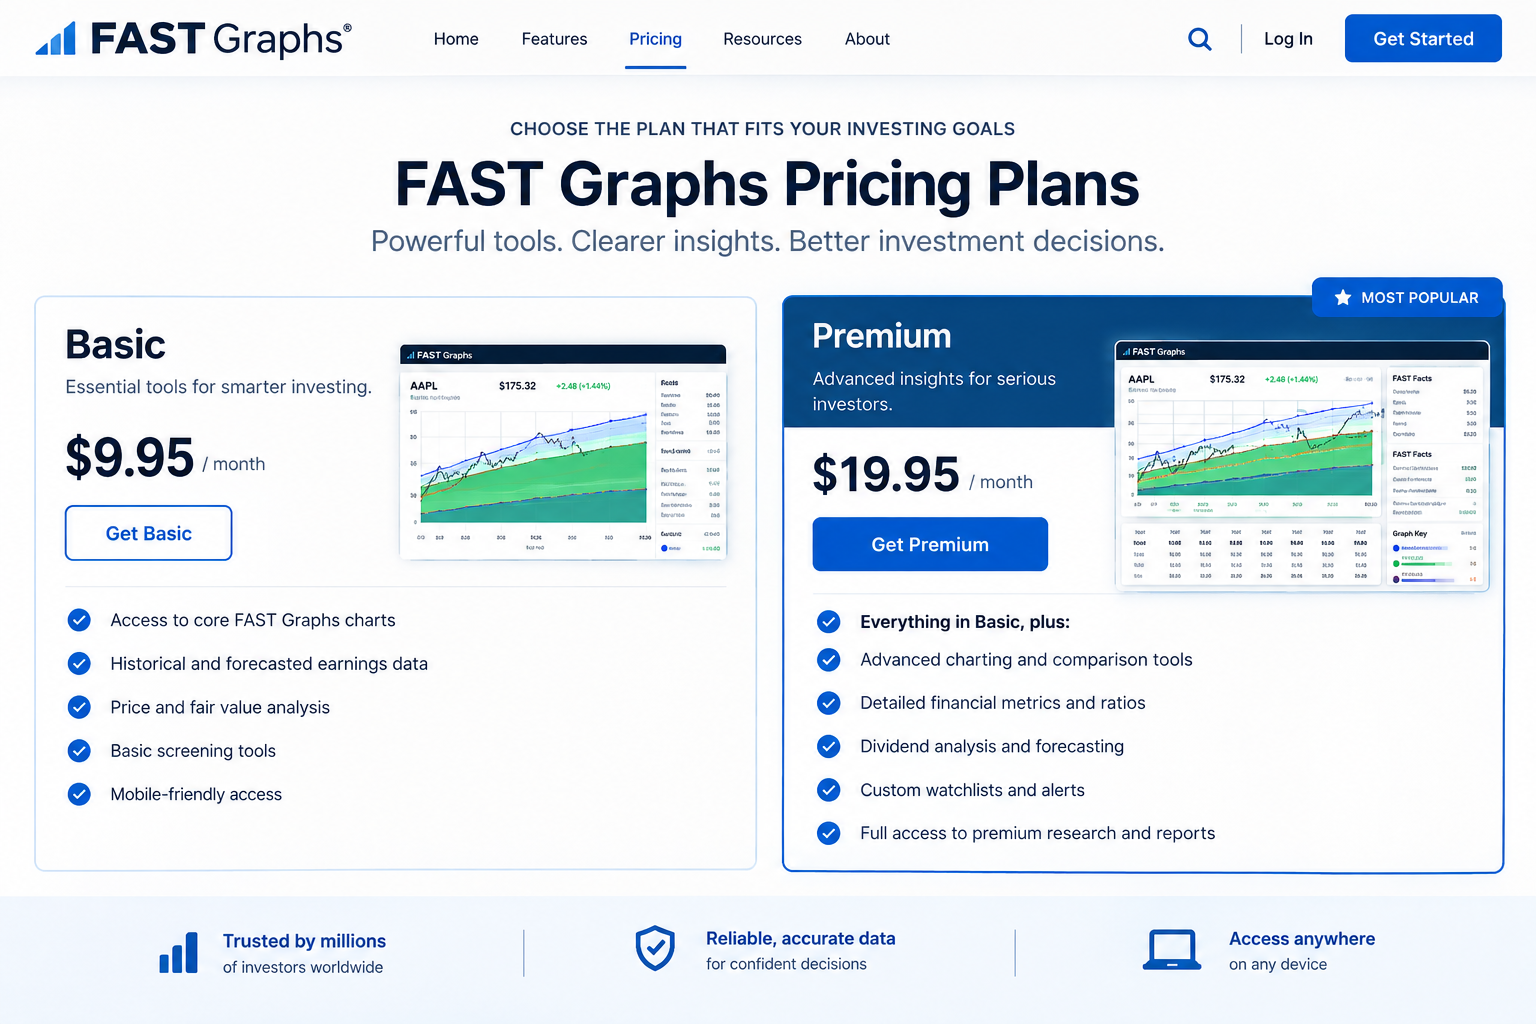
FAST Graphs costs $19.95 a month for Basic or $49.95 a month for Premium, with annual billing cutting either price by roughly 17% to 20%, and a 7-day free trial to test the workflow before you pay anything. Which tier makes sense depends entirely on whether you need the screener and broker-connected Portfolio Analyzer, or just the core valuation chart.
Here's the actual math:
| Plan | Monthly | Annual (per month) | Annual (per year) |
|---|---|---|---|
| Basic | $19.95 | $15.95 | $191.40 |
| Premium | $49.95 | $40.00 | $480.00 |
| International add-on | +$10/mo | included in annual add-on | +$100/yr |
Basic gets you the core earnings-and-price graph, the FG Score, and forecasting calculators for individual stocks. It does not include the screener, FUN graphs (the sales-and-cash-flow variant charts), advanced portfolio tools, or broker connections.
Premium adds the screener, full graph suite, and the broker-connected Portfolio Analyzer that lets you audit your real holdings against fair value in bulk.
Decision rule: if you research one or two stocks a month by hand and mainly want the valuation chart, Basic at $191.40 a year covers you and Premium is overkill. If you manage an actual portfolio of 15+ positions and want a standing valuation check across everything you own, plus the ability to screen for new ideas, Premium's $480 a year is the tier that matches the job.
How to get the best deal: run the 7-day trial first, since the pricing page doesn't require a card to start. Decide inside that week whether you'd actually use the screener and Portfolio Analyzer, since that's the entire value gap between the two tiers. If you would, pay annually. The $69.60 gap between monthly and annual Basic, or the $119.40 gap on Premium, is real money for a tool you're going to use every month anyway.
For a smaller account, say under $50,000 in a self-directed dividend portfolio, $480 a year on Premium is a real cost to weigh against your expected dividend income. That's not a knock on the product. It's math you should do before you subscribe, not after your first renewal notice.
FAST Graphs vs Simply Wall St vs GuruFocus vs Stock Analysis Pro
| FAST Graphs | Simply Wall St | GuruFocus | Stock Analysis Pro | |
|---|---|---|---|---|
| Starting price | $19.95/mo (Basic) | Free tier; paid plans roughly $12,$20/mo (check current pricing) | Free tier; premium plans roughly $30,$50/mo (check current pricing) | Roughly $5,$10/mo (check current pricing) |
| Fair value method | Historical blended P/E vs earnings line | Discounted cash flow "fair value" snowflake | Multiple valuation models blended (DCF, Peter Lynch chart, etc.) | Simplified valuation ratios and screens |
| Data source | FactSet (since 2019) | Third-party aggregated fundamentals | Proprietary and aggregated data | Aggregated fundamentals |
| Screener | Premium only | Yes, all paid tiers | Yes | Yes |
| Mobile app | None (web only) | iOS and Android | iOS and Android | Web-focused |
| Best for | Fundamentals-first dividend and value investors who want one clean valuation chart | Visual-first investors who want an at-a-glance snowflake summary | Guru-focused investors who want multiple valuation models and 13F tracking | Budget-conscious investors who want basic screens and clean data tables |
Pricing for Simply Wall St, GuruFocus, and Stock Analysis Pro shifts often enough that we're giving ranges here rather than pretending we have live numbers. Check each provider's current pricing page before you commit. Our full Simply Wall St review breaks down that snowflake methodology in more detail if you're weighing the two side by side.
What do real users say about FAST Graphs?
A FAST Graphs review that ignores r/dividends is missing the people who actually pay for it.
FAST Graphs users on Reddit's r/dividends and similar forums consistently praise the earnings-and-price chart as the clearest visual valuation tool they've used, while price is the recurring complaint. That split shows up almost every time the tool comes up in a thread.
The praise tends to sound like: the chart makes overvaluation obvious in a way spreadsheets don't, and long-time users say it's changed how they think about entry points on quality dividend growers. Several threads describe using the free trial specifically to sanity-check a position before adding to it, then deciding whether the subscription earned its keep over a full year.
The pushback is just as consistent: $49.95 a month feels steep for something that's "just a chart," especially next to free alternatives that show basic valuation ratios at no cost. Some users also flag the interface as visibly dated compared to newer, sleeker fintech dashboards, even if the underlying data holds up.
One honest caveat on the evidence itself: community sentiment outside Reddit is thin. FAST Graphs has essentially one Trustpilot review at the time of this testing, which is a small sample for a tool that's been around since 1992. That thinness is itself part of the story, and it's a real factor in the Community Verdict score below. Volume isn't quality, but a near-total absence of solicited review activity means we're leaning almost entirely on unsolicited forum chatter, which skews toward complaints by nature.
Where does FAST Graphs fall short?
The honest half of any FAST Graphs review lives here.
FAST Graphs' biggest weaknesses are price relative to account size, a thin Basic tier, a dated interface, and the complete absence of a mobile app. None of these are dealbreakers for the right user, but all four are real costs you should weigh before subscribing.
- Price stings for smaller accounts. $480 a year on Premium is a meaningful chunk of dividend income for an account under $50,000. It's not expensive relative to institutional data tools, but it's expensive relative to a retail investor's realistic budget for research software.
- Basic is thin. No screener, no FUN graphs, no broker connections. You're buying the core chart and not much else, which is fine if that's genuinely all you want, but it's worth knowing upfront rather than discovering it mid-trial.
- The interface looks dated. This is a tool built by an analyst for analysts, not a design studio. If you're used to the polish of modern fintech apps, the FAST Graphs UI will feel like a step back in time, even though the underlying data and logic are current.
- No mobile app, at all. For a subscription north of $20 a month, that's an unusual gap in 2026. You're checking valuations from a browser tab, not a native app, every single time.
- Built for fundamentals only. If you trade on price action, support and resistance, or short-term breakouts, FAST Graphs has nothing for you. It's not trying to be a technical tool, and it says so.
FAST Graphs pros and cons at a glance
✅ What we love
- The earnings-and-price graph makes overvaluation and undervaluation visually obvious in a way most tools bury in ratio tables.
- The analyst scorecard tells you how much to trust the forward estimates, a transparency layer most competitors skip entirely.
- Forecasting calculators turn a growth assumption into an actual expected-return number you can defend or challenge.
- Over three decades of the same valuation discipline from Chuck Carnevale, with FactSet-grade data backing it since 2019.
- The Portfolio Analyzer connects your real holdings to the same fair-value scrutiny as a new idea.
❌ What could be better
- Premium at $49.95 a month is a real expense for a small account.
- Basic strips out the screener, FUN graphs, and broker connections, so the cheap tier isn't the full product.
- No mobile app, and the web interface looks like it hasn't had a design refresh in years.
- Zero use for technical or short-term traders, by design.
- Thin community evidence outside Reddit, with essentially one Trustpilot review to go on.
Who should buy FAST Graphs?
The practical end of this FAST Graphs review: who gets real value.
FAST Graphs makes the most sense for self-directed dividend growth and value investors who hold individual stocks for years and want a fast, visual answer to "is this priced fairly right now." It's also a solid fit for financial advisors managing client portfolios who need a quick valuation gut-check across many names.
You're a good fit if:
- You already buy and hold quality dividend payers or value stocks for the long term, not for a quarterly trade.
- You want a repeatable valuation process instead of relying on gut feel or a stock's 52-week range.
- You manage 15 or more individual positions and want Portfolio Analyzer to flag when a winner has run past fair value.
- You're willing to pay for institutional-grade data (FactSet) instead of piecing together free sources.
Who should skip FAST Graphs?
Skip FAST Graphs if you trade short-term, invest exclusively in index funds and ETFs, or manage a small account where $191 to $480 a year competes directly with your investable capital. It's also not the right tool if you need a native mobile app to check positions on the go.
You should skip it if:
- You're a technical or swing trader focused on chart patterns, breakouts, and price action. FAST Graphs has nothing for that setup.
- You're a buy-and-hold index investor with no individual stock picking to do. There's no valuation chart to run on a total market fund.
- Your account is small enough that the annual fee represents a meaningful drag on returns before you've bought a single share.
- You need everything on your phone. The lack of an app is a hard stop for some people, and that's a legitimate reason to walk.
If any of that sounds like you, our comparison hub has head-to-head breakdowns of tools built for different workflows, and the AI stock screeners guide is a better starting point if screening, not valuation charting, is the actual job you need done.
FAST Graphs Alpha Score breakdown
This FAST Graphs review scores five pillars at 20 points each, and the breakdown sits before any affiliate link on purpose.
FAST Graphs scores 74 out of 100 on the FullStack Alpha scale, tested September 21, 2026. Full pillar breakdown below, published before any affiliate link, as our methodology requires.
| Pillar | Score | Verdict |
|---|---|---|
| Signal Quality | 17/20 | The valuation chart does what it claims. FactSet data and a transparent P/E-band method hold up under real use. |
| Transparency | 18/20 | The analyst scorecard and visible fair-value methodology are the strongest transparency showing in this category. Nothing here is a black box. |
| Price-to-Value | 12/20 | Premium's $480 a year is a real cost against what a smaller dividend account can justify, and Basic strips out enough features to feel like a teaser. |
| Usability | 14/20 | Functional but dated. No mobile app is a genuine drag on a subscription at this price point in 2026. |
| Community Verdict | 13/20 | Reddit sentiment is positive on the workflow and negative on price. Outside sources are too thin to corroborate much either way. |
| Total | 74/100 |
See our full how we test page for the methodology behind every pillar.
FAST Graphs review FAQ
Is FAST Graphs worth it?
FAST Graphs is worth it if you're a dividend growth or value investor managing a real portfolio of individual stocks, where the earnings-and-price chart and Portfolio Analyzer replace hours of manual spreadsheet work. It's a harder case to make for a small account or an investor who only holds index funds.
How much does FAST Graphs cost?
FAST Graphs Basic costs $19.95 a month or $15.95 a month billed annually ($191.40 a year). Premium costs $49.95 a month or $40 a month billed annually ($480 a year). An international add-on covering roughly 80,000 additional symbols runs an extra $10 a month or $100 a year.
Who is Chuck Carnevale?
Chuck Carnevale, known online as "Mr. Valuation," co-founded FAST Graphs in 1992 with programmer Tim Loudin after five decades in the investment industry. He remains the public face of the platform's earnings-and-price valuation method.
FAST Graphs vs Simply Wall St, which is better?
FAST Graphs uses a historical blended P/E chart built on FactSet data and skews toward fundamentals-first investors who want one clean valuation view. Simply Wall St uses a discounted cash flow "snowflake" visual, has a free tier, and ships native mobile apps, making it more accessible for casual research.
Is there a free trial for FAST Graphs?
Yes. FAST Graphs offers a 7-day free trial for new subscribers, and the main pricing page doesn't require a credit card to start. Some other signup funnels may ask for payment details, so check the exact page you're signing up through.
Does FAST Graphs have a mobile app?
No. FAST Graphs is web-only, with no dedicated iOS or Android app as of this testing. You access the full platform through a browser on desktop or mobile.
What data does FAST Graphs use?
FAST Graphs has run on FactSet data since 2019, covering roughly 18,000 US and Canadian symbols on the base plan, with an additional 80,000 international symbols available through a paid add-on.
Is FAST Graphs good for dividend investors?
Yes, it's built for exactly this use case. Dividend growth investors use the earnings-and-price chart to check whether a quality payer is trading above or below its historical fair value before adding shares, and the Portfolio Analyzer applies that same check across an entire dividend portfolio on Premium.
Is FAST Graphs good for dividend investors?
It is one of the best fits in the category. The earnings-and-price chart, the dividend overlay and the analyst scorecard answer the two questions dividend growth investors ask most: is the payout covered, and am I overpaying for it.
What is the FAST Graphs analyst scorecard?
A history of how close analyst earnings estimates came to the real results for that company, one and two years out. A poor scorecard tells you to discount the forecast, which is a check most valuation tools do not offer.
What is the most accurate free stock predictor?
There is no accurate stock predictor, free or paid. FAST Graphs does not predict prices; it shows you where price sits relative to earnings, which is the Benjamin Graham and Warren Buffett approach of buying a good business at a fair price and letting time do the work.
FAST Graphs review: final verdict
FAST Graphs earns its 74/100 by doing one job better than almost anything else in this category: showing you, at a glance, whether you're about to overpay for a good company. Subscribe if you're a self-directed dividend growth or value investor with a real portfolio, you're tired of eyeballing P/E ratios in a spreadsheet, and you're willing to pay for FactSet-grade data over a free scraper tool.
Skip it if you're a technical trader, a pure index investor, or running an account small enough that $191 to $480 a year competes with your actual investing capital. The tool doesn't have a signal problem. It has a price-to-value problem for a specific slice of its audience, and the missing mobile app doesn't help.
Next step: run the 7-day trial on one or two positions you already own or are considering. If the fair-value chart changes how you'd size the trade, the subscription has already paid for a chunk of itself. If it doesn't move your decision, save the $480 and stick with the free tools until your portfolio grows into it.
One tool, scored five ways. Browse more head-to-head breakdowns and category guides in the FullStack Alpha reviews section and the blog, or start from the directory if you're still deciding what kind of tool actually fits your process.
Sources checked for this FAST Graphs review
- FAST Graphs
- FAST Graphs affiliate and company pages
- Chuck Carnevale on Seeking Alpha
- FAST Graphs reviews on Trustpilot
- r/dividends thread on FAST Graphs
- r/dividends comment on the analyst scorecard
- r/SecurityAnalysis thread on FAST Graphs pricing
- r/dividends comment on affordability
- FactSet
- Simply Wall St plans
- GuruFocus pricing
This post contains affiliate links. If you subscribe through one, we may earn a commission at no extra cost to you.
We test the tools. You get the verdict.
One email a week. What we tested, what scored, and what we'd skip. Written for traders, not for clicks.