
FullStack Alpha
Review
Simply Wall St logo

Simply Wall St Review

The best-looking research tool on the board, and the one users most often describe as pretty rather than useful.

Listen to this review
Audio in production

What Simply Wall St Actually Looks Like

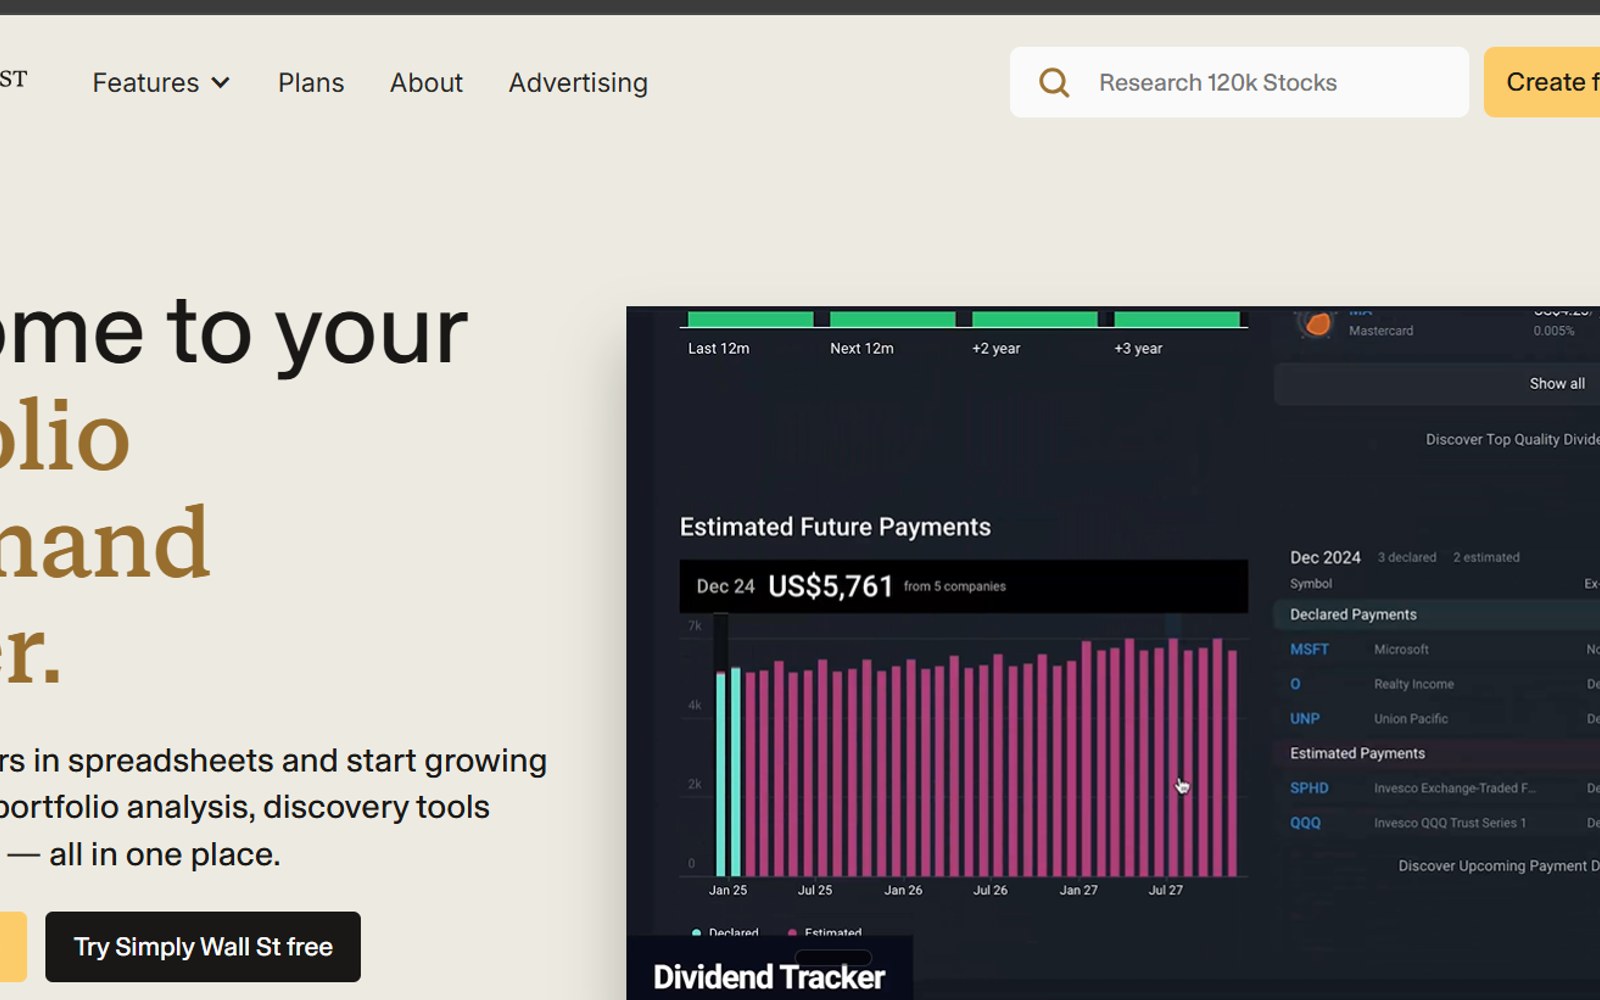
Screenshot of the Simply Wall St homepage
The Simply Wall St homepage
Editorial Deep Dive

Simply Wall St Review 2026: Is the Snowflake Actually Reliable?

Simply Wall St review 2026: Alpha Score 76/100. We test the Snowflake, the DCF fair value model, pricing, and where it actually falls short.

Read the full Simply Wall St teardown
  • Length4,700 words
  • Read time21 min
  • RefreshedEvery 6 to 12 months

The Verdict

Simply Wall St solved a real problem: fundamentals are boring to read and the Snowflake makes them scannable in two seconds across 90-plus markets. That is a genuine achievement and 4,948 Trustpilot reviewers averaging 4.3 did not arrive by accident. The complaint that recurs in investing subreddits is narrower and sharper than hostility. It is that the analysis has no human in it. The DCFs are generated, not judged, so a cyclical at the top of its cycle gets flagged undervalued — precisely when it is most dangerous. Use it as a fast first filter on a company you have never heard of and it earns its money. Use it as the reason you bought and you have outsourced judgment to a spreadsheet with good typography.

The Watch-Out

We could not verify Simply Wall St's web prices first-party. The pricing page loads its price cards from a client-side API that never fires for any automated client we tried, across five separate methods. The only first-party dollar figure available anywhere is the Apple App Store in-app purchase line, Unlimited Yearly at $259.99. We are not publishing a monthly number we cannot stand behind. Check the checkout price yourself. Also note that Stocks per Watchlist is capped at 50 on every tier including Unlimited, so Unlimited Watchlists means unlimited lists, not unlimited stocks in them.

Who It's For

Hover, tap, or focus a card to see who we'd point at this tool — and who should walk away.

Who this is for

The traders who get the most out of Simply Wall St.

Flip to see the list

Who this is for

  • Investors who want a two-second read on a company before committing an hour to it
  • Anyone covering non-US markets, where the coverage genuinely beats US-centric rivals
  • Visual thinkers who find a balance sheet easier to judge as a shape than a table

Who this isn't for

Where Simply Wall St is the wrong spend.

Flip to see the list

Who this isn't for

  • Anyone who wants a valuation with a human analyst's judgment behind it
  • Deep-value investors working on cyclicals, where the auto-DCF is least reliable
  • Traders — this is end-of-day data, and it does not pretend otherwise

The Pain It Solves

A real complaint from the trading forums, and what this tool actually does about it.

—
r/ausstocks
“I just never found the "analysis" particularly useful. It doesn't seem like there's any actual human input into those figures. It's just pretty graphs they generate from historical data.”

Source: r/ausstocks

Simply Wall St logo

Simply Wall St

That criticism is correct and it is also the instruction manual. Simply Wall St is a triage tool, not a verdict. Use the Snowflake to decide whether a company deserves an hour of your time, then do that hour somewhere else — filings, transcripts, a second screener. The investors who get burned are the ones who treat the generated DCF as a conclusion. The ones who get value treat it as a question.

What Users Say

Sentiment pulled from one independent source, kept separate so you can weigh each one yourself.

Reddit logor/ausstocksReddit
“So I jumped on Simply Wall St when it launched years ago and got it at what I thought was a very responsible price (I think it was something like $50-$60 AUD). I thought it was great at that price, mostly for the stock screener functionality. After that first year they jacked up the prices and it became not worth it for me. They tend to offer EOFY discounts, but even then it's hard to justify paying more than $100 for something any brokerage platform that has stock screen functionality does (and often for free as part of the service).”
Read the original on Reddit →
Reddit logor/dividendsReddit
“I use it sometimes to get a quick idea of a DCF but the valuations often don’t make much sense like cyclicals at the top of the cycle will be considered undervalued. If you followed them, you would lose all your money. So basically the same as a random stock analyst”
Read the original on Reddit →
Reddit logor/ValueInvestingReddit
“I wouldn’t say it is great at ‘valuing companies’ per se but I find it a very useful tool for getting a fast and wide view on a company before I drill down into data using a variety of sources. It is good for various things in my opinion such as screening, watchlist management and post investment monitoring. I don’t rely on it solely though.”
Read the original on Reddit →
Reddit logor/ValueInvestingReddit
“I like their data. They provide 10 years of data on revenue, profit and free cash flow on stocks not only in the US, UK and many other countries. The hexagon also provides a quick glance of where the company stands. Not sure about their earning and dividend forecast though. About their valuation capability, they made some improvements by providing 3 narratives: pessimistic, optimistic and neutral. They also provided a calculation for one of the narratives. It helps you to understand how they arrive at a forecasted intrinsic share price and where their parameters come from. I am not always confident in their parameters though - they tend to be optimistic to me... For the free tier or sold at a discount, I think it's a decent value for money. When you invest always make your own valuation, but they provide you the numbers to start your own calculations.”
Read the original on Reddit →
Reddit logor/dividendsReddit
“I haven't been impressed. Models are overly simplistic and appear to be built by just scraping SEC filings. Considering the fact that they try to cover essentially the entire market, one has to really ask themselves if it's even plausible for them to do anything well enough to warrant your time/money.”
Read the original on Reddit →

Every quote is real and traceable. How we source them →

Pricing

Free

$0

5 company reports a month, 1 portfolio capped at 10 holdings, 5 watchlists, and a screener that returns only the top 4 results. Ads shown, no Charlie AI, no export.

Our pick

Premium

Not published pre-checkout

30 reports a month, 3 advanced portfolios at 30 holdings each, 20 watchlists, 10 saved screeners with alerts, broker sync, Charlie AI, ad-free. Starts with a 7-day trial that needs no card.

Unlimited

$259.99 / year per the Apple App Store; web price not published

Unlimited reports, portfolios, watchlists and screeners, plus Excel and PDF export — the only tier with export. Apple-billed pricing may differ from web checkout.

Prices change. Check the vendor’s page before you buy.

Pros and Cons

What works

  • The Snowflake is the clearest at-a-glance company summary any tool on our board produces
  • Coverage spans 100,000-plus stocks across 90-plus markets, not just the US
  • The 7-day Premium trial requires no credit card and drops to Free rather than auto-billing, which is rare and honest
  • 14-day full refund window on paid plans

What doesn’t

  • The valuations are auto-generated with no human judgment, and users say so repeatedly
  • Cyclicals at peak earnings get flagged undervalued, which is the worst possible time to be wrong
  • Web pricing is not published anywhere we could reach — you find out at checkout
  • Watchlists cap at 50 stocks on every tier, including the one called Unlimited
  • Data is end-of-day, and App Store reviewers report lag even on post-close updates

Simply Wall St FAQ

The Alpha Report

We test the tools. You get the verdict.

One email a week. What we tested, what scored, and what we'd skip. Written for traders, not for clicks.

No spam. Unsubscribe anytime.

Related Reading