

Simply Wall St Review 2026: Is the Snowflake Actually Reliable?
Short on time? The Simply Wall St Alpha Score scorecard covers pricing, the verdict and what traders actually say, in about 90 seconds.
See the score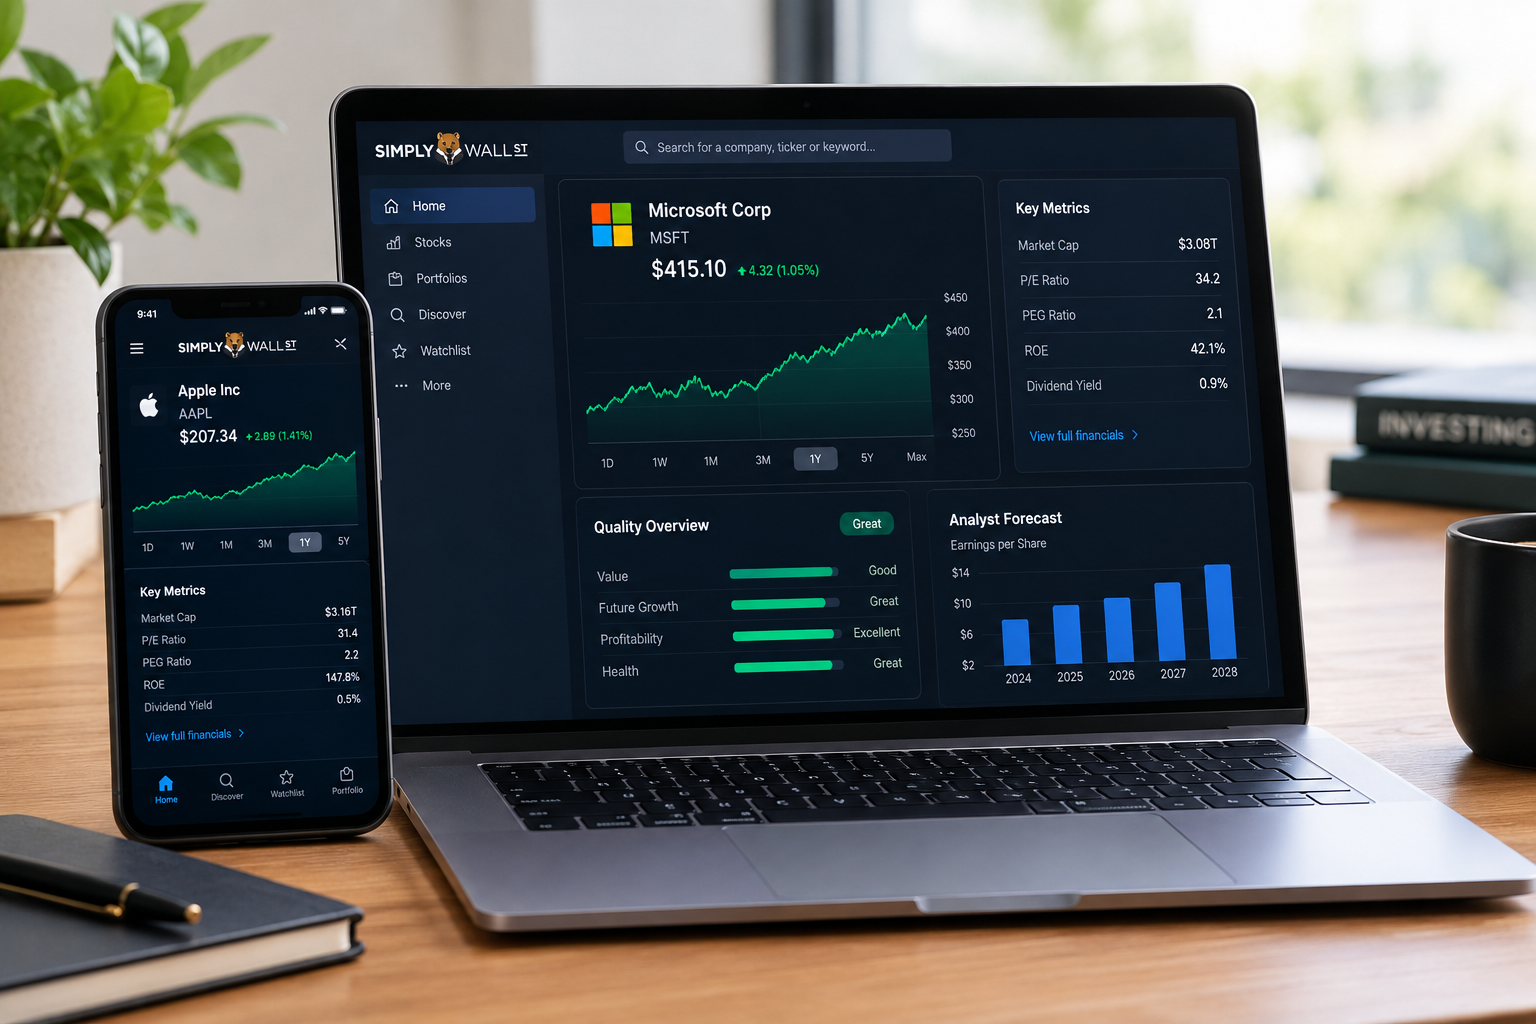
Simply Wall St review verdict: it earns a 76/100 Alpha Score, a solid, honestly-documented fundamentals tool for long-term and dividend investors, desk-researched and last tested September 21, 2026. It's not a charting platform and it won't tell you when to buy. It will tell you, in about ten seconds, whether a stock is cheap, healthy, growing, and paying you to wait.
Simply Wall St review: key takeaways
- The Snowflake scores every stock on 5 factors: value, future growth, past performance, financial health, and dividends, across 120,000+ stocks in 90 markets.
- The DCF (discounted cash flow) fair value model is published openly on GitHub, so you can actually check the math instead of trusting a black box.
- Free plan: 5 company reports a month, 1 portfolio, 10 holdings. Premium: $131.40/yr ($10.95/mo billed annually), 30 reports a month, 3 portfolios of 30 holdings, broker linking. Unlimited: $258/yr ($21.50/mo billed annually), no caps.
- The portfolio tracker links to 2,000+ brokers and calculates true returns, including IRR and currency impact, not just raw price change.
- On the Apple App Store, Simply Wall St carries a 4.62 rating from 2,412 ratings, a genuinely strong mobile signal.
- The 7-day Premium trial doesn't require a card, so you can test the workflow before Simply Wall St gets a cent from you.
- Alpha Score: 76/100, built from Signal Quality (13/20), Transparency (18/20), Price-to-Value (15/20), Usability (17/20), and Community Verdict (13/20).
What does Simply Wall St actually do?
Every Simply Wall St review should start with the job the tool actually does, so here it is in plain English.
Simply Wall St turns a company's 10-year financial history into a single visual snapshot, so you can size up a stock before you've finished your coffee. That's the whole pitch, and it mostly delivers on it.
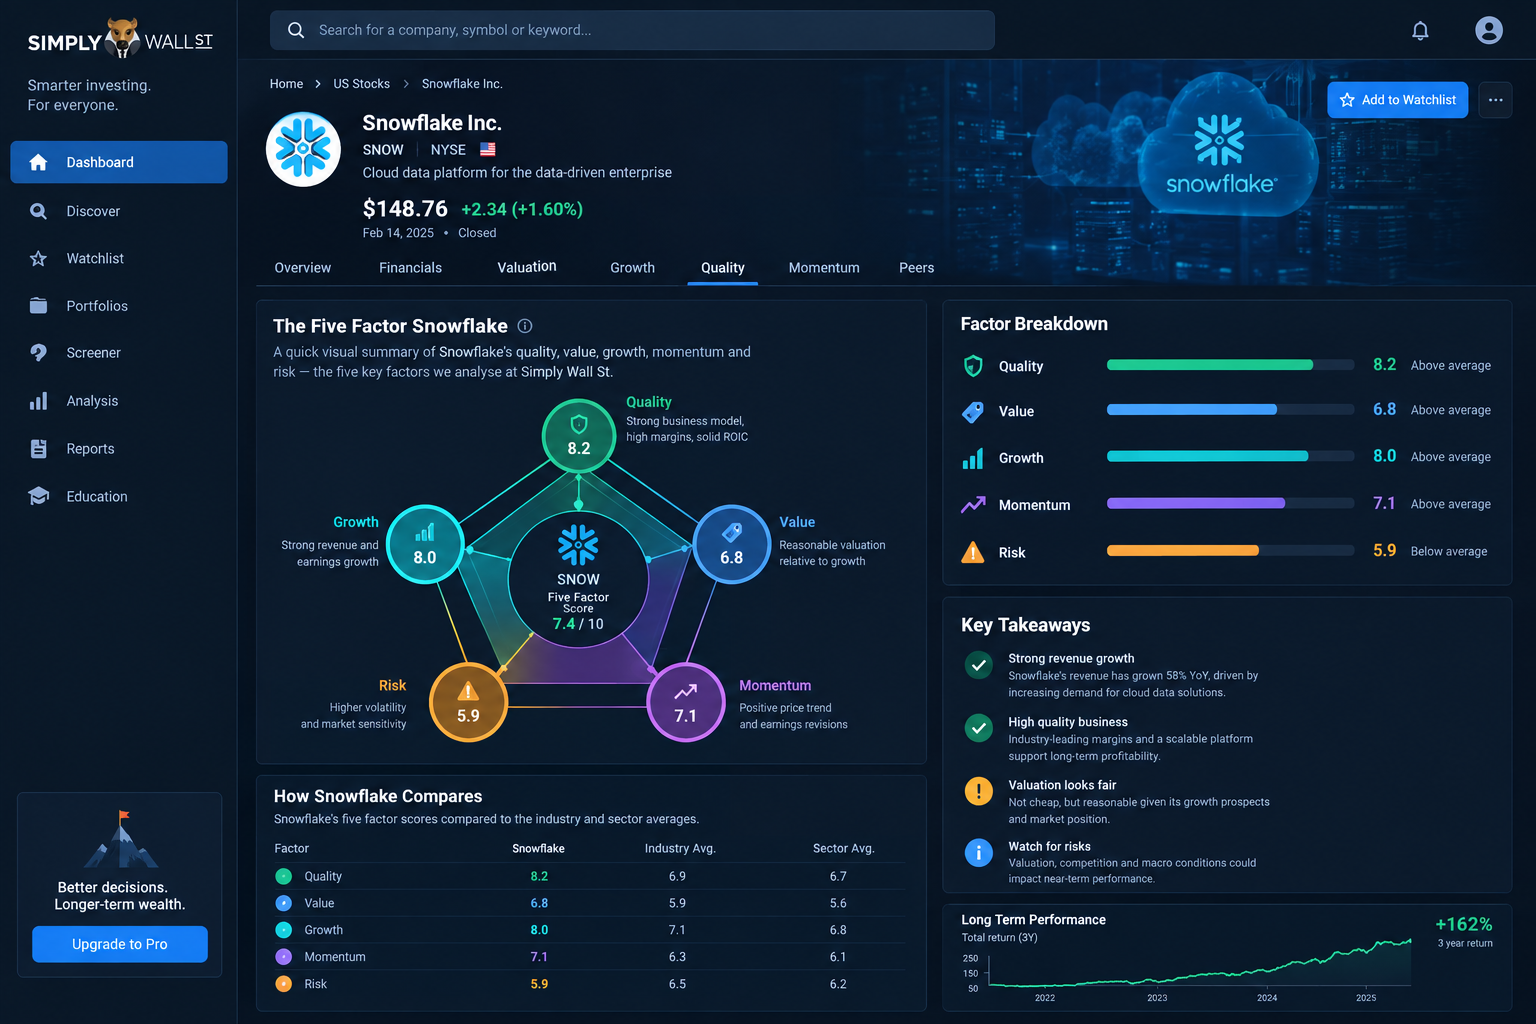
Here's the feature list, matched to the actual problem each one solves for you:
- The Snowflake. A five-petal shape that scores value, future growth, past performance, financial health, and dividends. Benefit: you get a read on a stock's fundamentals in about ten seconds instead of building a spreadsheet from a 10-K.
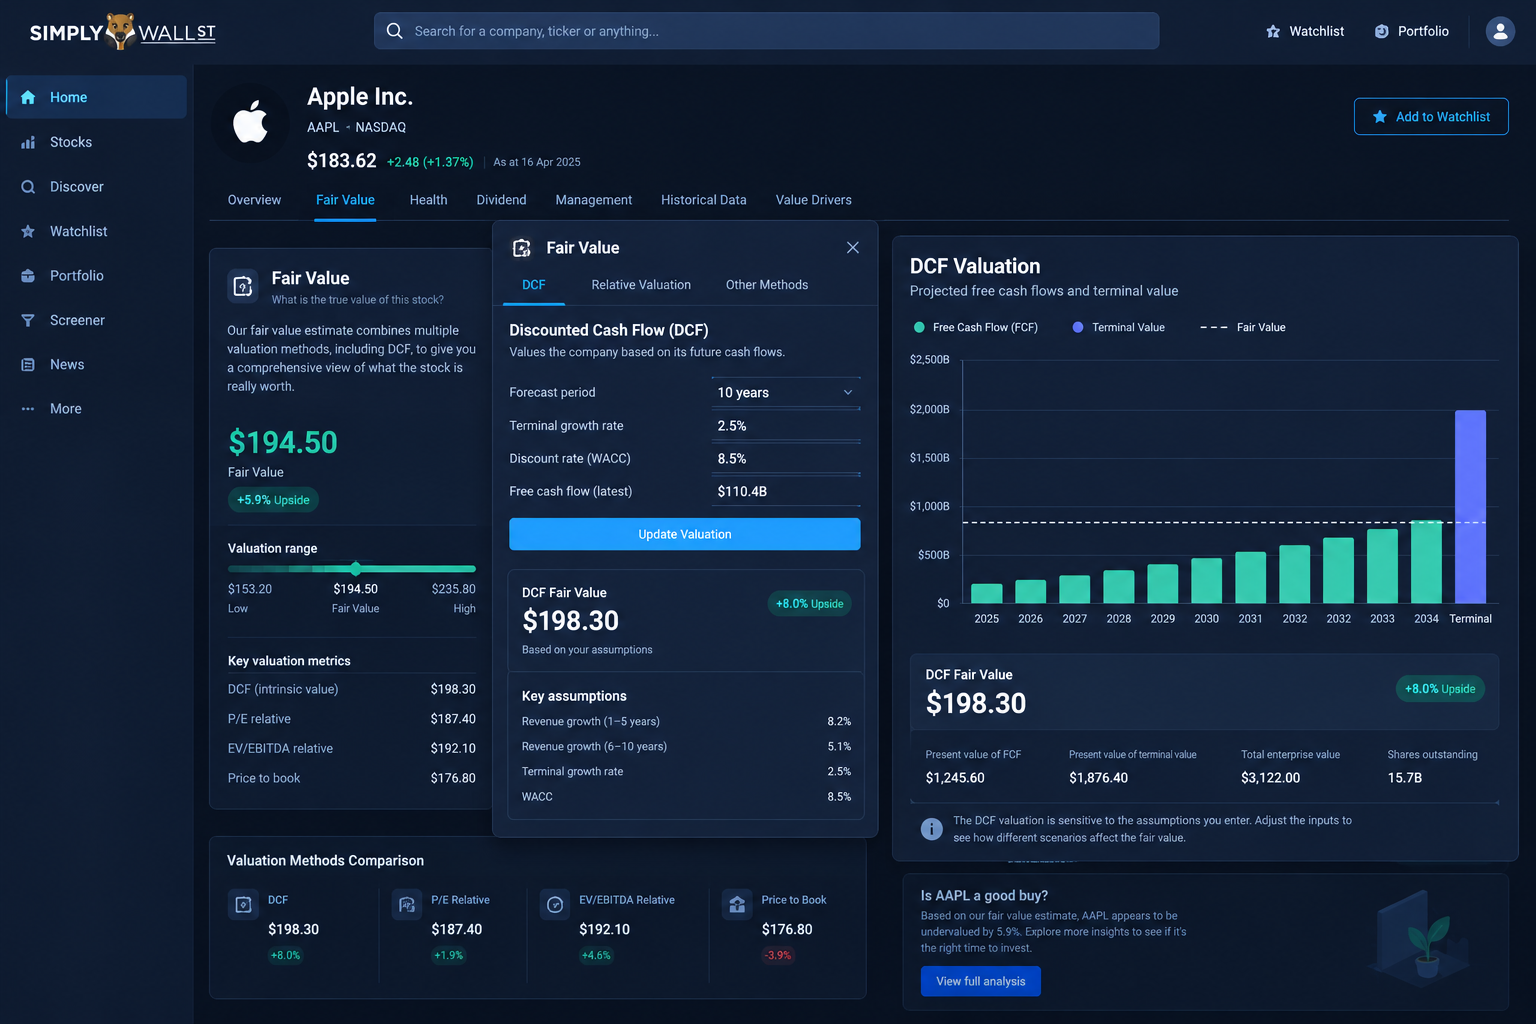
- Fair Value modal (added May 2026). Shows the DCF-derived intrinsic value next to Wall Street analyst price targets. Benefit: you see the company's own math against the crowd's math, side by side, instead of picking one blindly.
- Portfolio tracker with broker linking. Connects to 2,000+ brokers and pulls your actual holdings. Benefit: it calculates true returns, including IRR (internal rate of return, which accounts for the timing of your deposits) and currency impact, so your "return" isn't just a misleading price chart.
- Dividend calendar and forecasts. Tracks ex-dividend dates and projects future payouts based on historical growth. Benefit: dividend investors can plan cash flow instead of guessing when a check shows up.
- Community Narratives. Other investors publish their own thesis and fair value estimate on a stock, visible next to the model's number. Benefit: you get a second opinion that isn't paid research and isn't anonymous Reddit noise either.
- Screener. Filters across the 120,000+ stock universe by Snowflake score, sector, market cap, and more. Benefit: you can hunt for undervalued, healthy dividend payers without opening 40 tabs.
If you've been bouncing between Yahoo Finance for a quick look and your broker's screener for filters, Simply Wall St is trying to be the single stop that replaces both, at least for the fundamentals side of the job. For the technical side, you'll still want a charting tool, and our ai stock screeners guide breaks down where those fit.
Simply Wall St review: how does the Snowflake score a stock?
The Snowflake is a five-sided radar chart, and each point is scored 0 to 6 based on a specific set of checks. It's not a mystery gauge. Here's what each factor actually measures:
- Value. Compares the current share price to the DCF fair value and to peer multiples like P/E. A high score means the stock is trading below what the model thinks it's worth.
- Future growth. Looks at forecast earnings and revenue growth relative to the market and the sector. A high score flags a company expected to outgrow its peers.
- Past performance. Checks trailing earnings growth, margin trends, and return on equity over multiple years. This is a rear-view mirror, not a prediction, and Simply Wall St labels it that way.
- Financial health. Debt-to-equity, interest coverage, and short-term versus long-term liabilities. A high score means the balance sheet can survive a bad year without panicking.
- Dividends. Yield relative to the market, payout sustainability, and consistency of payments over time. Built specifically for the income-focused investor who cares whether a dividend gets cut.
The practical takeaway: don't just glance at the shape of the flower. Click into the factor that matters most for your strategy. A dividend investor should weight the dividend and health petals far more heavily than the growth petal, and the platform lets you do exactly that by drilling into each score's breakdown.
Is Simply Wall St reliable for fair value?
This is the question that decides whether a Simply Wall St review is worth reading at all.
Simply Wall St's fair value estimate is more trustworthy than most retail tools because the DCF (discounted cash flow) model behind it is published openly on GitHub, meaning anyone can read the actual formula instead of taking the company's word for it. That transparency is real and it's rare in this category.
Here's the catch. A DCF model projects a company's future free cash flow and discounts it back to today's dollars. That works cleanly for a stable business with predictable earnings. It works badly for a cyclical company (think miners, homebuilders, or airlines) whose earnings swing hard with the economic cycle.
The blind spot: at the peak of a cycle, a cyclical company's trailing and near-term earnings look great, so the model can flag the stock as "undervalued" right before earnings roll over. This is documented as a known weak spot, not a rumor.
How to sanity-check a fair value estimate before you trust it:
- Check where the company sits in its earnings cycle. If margins and earnings are at multi-year highs, treat a "cheap" DCF signal with suspicion.
- Compare the DCF fair value to the analyst price targets shown in the Fair Value modal. A wide gap between the two is a flag to dig deeper, not a tiebreaker to ignore.
- Look at the past performance petal alongside the value petal. A stock that scores high on value but low on past performance consistency is telling you something the single number won't.
The fix isn't to distrust the tool. It's to use it as a starting filter, not a final answer, the same way you'd treat any single valuation model. Process over prediction.
Has the Simply Wall St model been backtested?
No Simply Wall St review is complete without a straight answer on backtesting, so here is what the company publishes and what it does not.
Simply Wall St publishes its DCF methodology on GitHub and documents what the model does and doesn't account for, but the company does not publish an independently audited historical track record of the Snowflake score's predictive accuracy. That's a meaningful gap, and it's worth being straight about it instead of papering over it with invented numbers.
What Simply Wall St does publish:
- The DCF formula itself, including discount rate assumptions and growth projections, viewable on GitHub.
- Written explanations for what each Snowflake factor measures and how it's calculated.
- Clear labeling that past performance is historical, not a forecast.
What Simply Wall St does not publish:
- An audited win rate for stocks flagged as undervalued versus stocks that actually outperformed.
- A public backtest report comparing Snowflake scores against forward returns across market cycles.
No invented performance numbers here, because none exist to cite. If a tool in this category ever shows you a slick backtest chart with no methodology attached, that's a bigger red flag than a tool that admits it hasn't run one. Transparency about the model beats a marketing chart every time, which is exactly why this is the pillar Simply Wall St scores highest on.
What does Simply Wall St integrate with?
The integration list matters more than most Simply Wall St review pieces admit, because a tracker you cannot connect is a spreadsheet with better fonts.
Simply Wall St's portfolio tracker links to 2,000+ brokers, covers 90 markets, and runs on iOS and Android, but ETF coverage is limited to basic tracking with no full report, and mutual funds aren't covered at all. If your holdings are mostly individual stocks, integration is a genuine strength. If they're mostly funds, it's a real limitation.
What actually connects:
- Broker linking. Import your holdings automatically from 2,000+ supported brokers rather than typing in tickers and share counts by hand.
- 90 markets. From the NYSE and NASDAQ to the LSE, ASX, and dozens of others, with 10+ years of financial history per company.
- Mobile apps. Full-featured iOS and Android apps, which is where a chunk of the strong App Store rating comes from.
- ETF tracking, not ETF reports. You can hold an ETF in your tracked portfolio and see its price and return, but you won't get a Snowflake score or a fair value estimate for it, because the model is built for operating companies with cash flows, not baskets of them.
- No mutual funds. They're absent from the platform entirely, so if your 401(k) or ISA is mostly funds, Simply Wall St can't track it.
Decision rule: if your portfolio is a mix of individual dividend stocks and index ETFs, Simply Wall St handles the stock half well and the ETF half only superficially. Investors who are entirely fund-based should look elsewhere for a primary tracker.
How much does Simply Wall St cost, and is the free plan enough?
Pricing is where a Simply Wall St review earns its keep, so every number below was checked on the day of writing.
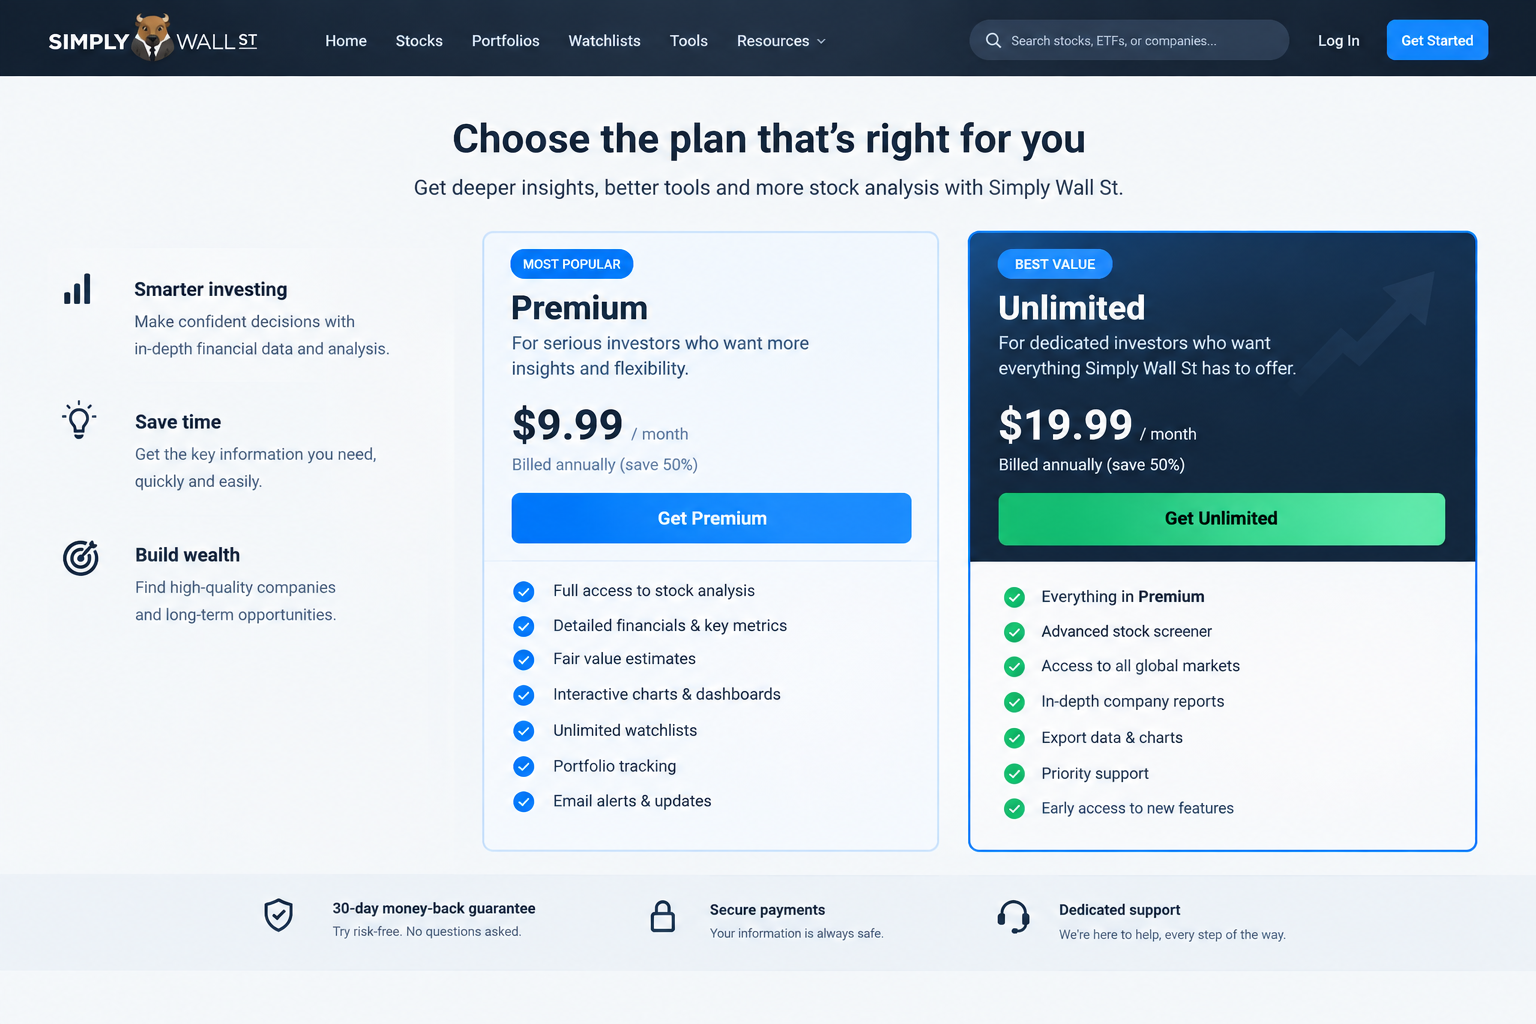
Simply Wall St's free plan is genuinely enough to test the workflow, but it caps you at 5 company reports a month and 1 portfolio of 10 holdings, which most active investors will outgrow within a few weeks. Premium runs $131.40/year ($10.95/month billed annually), and Unlimited runs $258/year ($21.50/month billed annually).
| Plan | Price | Reports per month | Portfolios | Holdings | Broker linking |
|---|---|---|---|---|---|
| Free | $0 | 5 | 1 | 10 | No |
| Premium | $131.40/yr ($10.95/mo) | 30 | 3 | 30 each | Yes |
| Unlimited | $258/yr ($21.50/mo) | Unlimited | Unlimited | Unlimited | Yes |
There's also a 7-day Premium trial that doesn't require a card, which is the right way to let someone test a tool. No card means no "oops, I forgot to cancel" charge three months later.
Who should pay, and for which tier:
- Stay on Free if you check a handful of stocks a year and don't need a linked portfolio. Five reports a month covers casual research.
- Upgrade to Premium if you're actively building a watchlist, want your actual broker balances synced, or run more than one portfolio (say, a taxable account and a retirement account). At roughly $11 a month, it fits the budget most self-directed investors already set aside for research tools.
- Upgrade to Unlimited only if you're managing 30+ holdings across multiple accounts and the caps are actually getting in your way, not just because "unlimited" sounds nice. For most retail investors, that's a needless upgrade.
Simply Wall St vs Seeking Alpha vs Stock Analysis Pro vs FAST Graphs
Any Simply Wall St review that skips the alternatives is doing half the job, so here is the side-by-side.
| Tool | Primary job | Price (approx.) | Charting | Fair value method | Best for |
|---|---|---|---|---|---|
| Simply Wall St | Visual fundamentals snapshot | Free / $10.95 mo / $21.50 mo | Minimal, no real charting | DCF, published on GitHub | Long-term and dividend investors who want a fast read |
| Seeking Alpha | Analyst articles + quant ratings | ~$299/yr Premium | Basic | Quant factor grades, not a single DCF | Investors who want written analyst opinions alongside data |
| Stock Analysis Pro | Financial statement deep dives | ~$25 to $30/mo | Basic to moderate | No proprietary fair value model | Investors who want raw financial statements fast |
| FAST Graphs | Historical P/E and earnings-growth charting | ~$9.99 to $39.99/mo | Strong, purpose-built | Normalized P/E versus earnings growth line | Investors who think in charts, not scorecards |
The practical read: Simply Wall St wins on speed-to-insight and documented methodology. It loses to FAST Graphs the moment you want to see a valuation trend drawn out over 20 years on an actual chart. Pick based on whether you think in shapes or in lines.

What do real users say about Simply Wall St?
A Simply Wall St review written only from the product page is marketing. Here is what paying users say.
Simply Wall St's App Store rating sits at 4.62 from 2,412 ratings, and Trustpilot sentiment leans positive on the core promise: a fast, visual way to understand a stock without a finance degree. That's a strong signal from an unprompted mobile audience, which tends to be harder to please than a solicited review site.
Common threads in the positive reviews:
- Users repeatedly call out the Snowflake as the reason they opened the app in the first place, saying it turns a wall of numbers into something they can actually act on.
- Several reviewers mention the dividend forecast feature specifically, which lines up with the platform's strength for income investors.
- The broker-linking portfolio tracker gets credit for showing "real" returns instead of just price movement, which matches the IRR and currency-adjustment feature.
For balance, here's the complaint that shows up on Reddit and deserves to be repeated, not buried: some users flag that the fair value score called a cyclical stock "cheap" right as its earnings peaked, and the stock later dropped as the cycle turned. That's not a bug. It's the documented DCF blind spot discussed above, showing up in the wild exactly where you'd expect it to.
The takeaway: the tool's biggest fans and its sharpest critics are describing the same feature from two different angles. The Snowflake is fast and clear. The DCF underneath it is honest math, not a crystal ball.
Where does Simply Wall St fall short?
The honest half of any Simply Wall St review lives here.
Simply Wall St's core weaknesses are structural, not cosmetic: no real charting, end-of-day prices only, holdings caps that nudge you toward a pricier tier, and no coverage for ETFs or mutual funds beyond basic tracking.
- No real charting. If you want to draw trendlines, mark support and resistance, or study price action, this isn't the tool. It's built for fundamentals, full stop.
- End-of-day prices only. There's no intraday data. If you need a live quote to time an entry, you'll be checking your broker anyway.
- Holdings caps push upsells. Free caps at 10 holdings and Premium caps at 30 per portfolio, which is a real limit for anyone with a genuinely diversified book, and it's clearly designed to move you to Unlimited.
- No full ETF reports, no mutual funds. You can track an ETF's price in your portfolio, but you won't get a Snowflake score for it, and mutual funds aren't supported at all.
None of this is a dealbreaker for the audience it's built for. It's a mismatch problem: a chart-first trader who ends up on Simply Wall St will be frustrated within a day, and that's the tool telling you clearly it's not for that job.
Simply Wall St Alpha Score breakdown
This Simply Wall St review scores five pillars at 20 points each, and the breakdown sits before any affiliate link on purpose.
Simply Wall St scores 76 out of 100 on the FullStack Alpha scale, built from five pillars worth 20 points each. This score is desk-researched and was last tested September 21, 2026.
- Signal Quality: 13/20. The Snowflake is a genuinely useful read on fundamentals, but the score isn't a forward-tested signal with a published win rate, and the documented cyclical blind spot means the "value" petal can mislead at exactly the wrong moment. That's a real gap, not a nitpick.
- Transparency: 18/20. The strongest pillar on the board. Publishing the DCF model on GitHub, showing the analyst-target comparison in the Fair Value modal, and clearly labeling past performance as historical rather than predictive are the kind of moves most tools in this category simply don't make.
- Price-to-Value: 15/20. At $10.95 a month for Premium, it fits the budget most self-directed investors already carry for research software, and the free plan is enough to test-drive the workflow. The holdings caps that push people toward Unlimited keep this from scoring higher.
- Usability: 17/20. Ten seconds to a readable snapshot on any of 120,000+ stocks is the platform's best feature. The mobile apps are polished and the interface doesn't require a manual.
- Community Verdict: 13/20. A 4.62 App Store rating from 2,412 reviews is solid, and Trustpilot sentiment leans positive. But the Reddit cyclical-stock complaint is a legitimate, recurring critique, and it keeps this pillar out of the top tier.
The score appears here, before any link to the product, because that's the order that keeps the review honest.
Simply Wall St review FAQ
Is Simply Wall St reliable?
It's reliable for what it's built to do: a fast, documented read on a company's fundamentals. It's less reliable as a standalone timing tool, especially for cyclical stocks, where the DCF fair value can look "cheap" right before earnings turn down.
Is Simply Wall St free?
Yes. The free plan includes 5 company reports a month, 1 portfolio, and 10 holdings, with no card required. It's enough to test the workflow before deciding whether to pay for Premium or Unlimited.
How accurate is the Simply Wall St fair value estimate?
The DCF model behind it is published openly on GitHub, so the math is checkable, which is more than most competitors offer. It performs best on stable, non-cyclical companies and worst on cyclicals at the top of their earnings cycle, a limitation the company itself effectively documents through the model's structure.
Does Simply Wall St link to brokers?
Yes, to 2,000+ brokers, letting you import real holdings and get true returns including IRR and currency impact. Broker linking is a Premium and Unlimited feature, not available on the free plan.
Premium vs Unlimited: which should I pick?
Premium ($131.40/yr) covers most self-directed investors with 30 reports a month and 3 portfolios of 30 holdings each. Unlimited ($258/yr) only makes sense if you're actively hitting those caps with a genuinely large, multi-account portfolio.
How do I cancel Simply Wall St?
Cancellation is handled through account settings on the website or app store billing (Apple or Google) depending on where you subscribed. The 7-day trial requires no card, so there's nothing to cancel if you're just testing it.
Does Simply Wall St cover ETFs?
Partially. You can track an ETF's price and performance inside your portfolio, but there's no full Snowflake report or fair value estimate for ETFs, since the DCF model is built around individual company cash flows.
Simply Wall St vs Seeking Alpha, which is better?
Simply Wall St is faster for a visual fundamentals snapshot and more transparent about its valuation math. Seeking Alpha leans harder into written analyst opinions and quant grades. Pick Simply Wall St if you want a five-second read; pick Seeking Alpha if you want to read someone's actual argument.
Is Simply Wall St written by AI?
The company reports and Snowflake scores are generated automatically from financial data, and the Community Narratives are written by users and analysts. Simply Wall St is transparent that its analysis is model-driven, which is why the DCF model is published on GitHub.
Who is behind Simply Wall St?
Simply Wall St Pty Ltd is based in Sydney, Australia, founded in 2014 by Al Bentley, and now serves investors in 90 markets. The company publishes its team and methodology on its own site.
What is better than Simply Wall St?
It depends on the job. Stock Analysis Pro wins on raw financial data and price, FAST Graphs wins on earnings-based valuation charts, and Seeking Alpha wins on written analysis. Simply Wall St wins on the fastest readable fundamentals view.
Which is better, Seeking Alpha or Simply Wall St?
They do different jobs. Simply Wall St is a fast, visual fundamentals check with a documented DCF; Seeking Alpha is written analysis and quant ratings. Beginners and dividend investors usually get more from Simply Wall St first; active researchers who read a lot lean Seeking Alpha.
Simply Wall St review: final verdict
Simply Wall St is built for one specific reader: the self-directed long-term or dividend investor who wants a fast, visually clear fundamentals check before buying, not a chart-first trader chasing an entry. At $10.95 a month for Premium, or free for casual use, it earns its 76/100 by being honest about how its model works and fast at showing you the result.
Subscribe if you're currently jumping between Yahoo Finance and a bare-bones broker screener and want one tool that shows value, growth, health, past performance, and dividends in a single glance, with a documented model behind it.
Skip it if you trade on price action, need intraday quotes, or your portfolio is mostly ETFs and mutual funds, because none of those jobs are what the Snowflake was built for.
Next step: run the 5 free reports on the stocks already sitting on your watchlist this week. No card, no commitment, just a quick check on whether the fundamentals agree with why you wanted the stock in the first place.
For a broader look at how tools like this stack up across the category, the ai stock pickers guide and our testing methodology explain how every score on this site gets built. Browse the full directory for 200+ more tools if Simply Wall St isn't the right fit for your setup.
Sources checked for this Simply Wall St review
- Simply Wall St official site
- Simply Wall St DCF model on GitHub
- Simply Wall St on the Apple App Store
- Simply Wall St on Google Play
- Simply Wall St reviews on Trustpilot
- r/ausstocks thread on Simply Wall St pricing
- r/dividends thread on DCF and cyclicals
- r/ValueInvesting thread on Simply Wall St data
- Seeking Alpha Premium pricing
- Stock Analysis Pro pricing
- FAST Graphs pricing
This post contains affiliate links. If you sign up through one, we may earn a commission at no extra cost to you.
We test the tools. You get the verdict.
One email a week. What we tested, what scored, and what we'd skip. Written for traders, not for clicks.