QQQ TradingView Chart Setup: 5 Indicators Nasdaq Traders Watch
Quick Answer: A clean qqq tradingview setup uses exponential moving averages, session VWAP, RSI, volume, and ATR to separate trend, participation, and risk. Start with the Nasdaq-listed fund, check the data feed, and give each indicator a separate job. TradingView helps day and swing traders read structure; its technical ratings aren't instructions to buy.
Key Takeaways
- Select NASDAQ:QQQ, rather than a similarly named broker instrument.
- Use TradingView technicals as context, not an entry command.
- Keep Nasdaq trend analysis separate from position sizing.
- Compare SPY and the fund using matched sessions and percentage charts.
- Save the qqq tradingview layout before adding community scripts.
- Check Yahoo Finance holdings because concentration can drive the whole basket.
What is QQQ on TradingView? Fund info, profile and classification
QQQ on TradingView is a chartable exchange-traded fund that follows the Nasdaq-100 index. Its classification is large-cap growth-oriented equity exposure, not a pure technology sector fund or a low float stock.
For “QQQ what is it,” start with ownership: the fund holds stocks selected under an index methodology. The index focuses on large nonfinancial Nasdaq-listed companies; it doesn't represent the entire stock market. An index return and a fund return can differ because of expenses and implementation.
The qqq tradingview page brings the fund profile, news, charts, and public ideas together. Older search results may say “QQQ Trust” or “Invesco QQQ Trust Series 1.” Check the current issuer description rather than treating an old name as proof of current legal structure.
Key stats: index scope. The Nasdaq-100 targets 100 large nonfinancial companies. Multiple share classes can make the security count different from the company count.
Key stats: dated price snapshot. September 2026 research reported roughly $741, with a 52-week range near $555.60,$748.65. Treat these as historical snapshot figures, not a live quote.
Key stats: concentration. The September 2026 holdings snapshot listed NVIDIA 8.5%, Apple 7.4%, Microsoft 6.0%, Micron 4.8%, and Amazon 4.5%. Fund weights change; refresh them before relying on this snapshot.
How do you set up a qqq tradingview chart?
Open the Nasdaq fund listing, launch the full chart, and confirm the symbol, session, and data status before adding indicators. A qqq tradingview layout with the wrong feed can look polished while describing a different instrument.
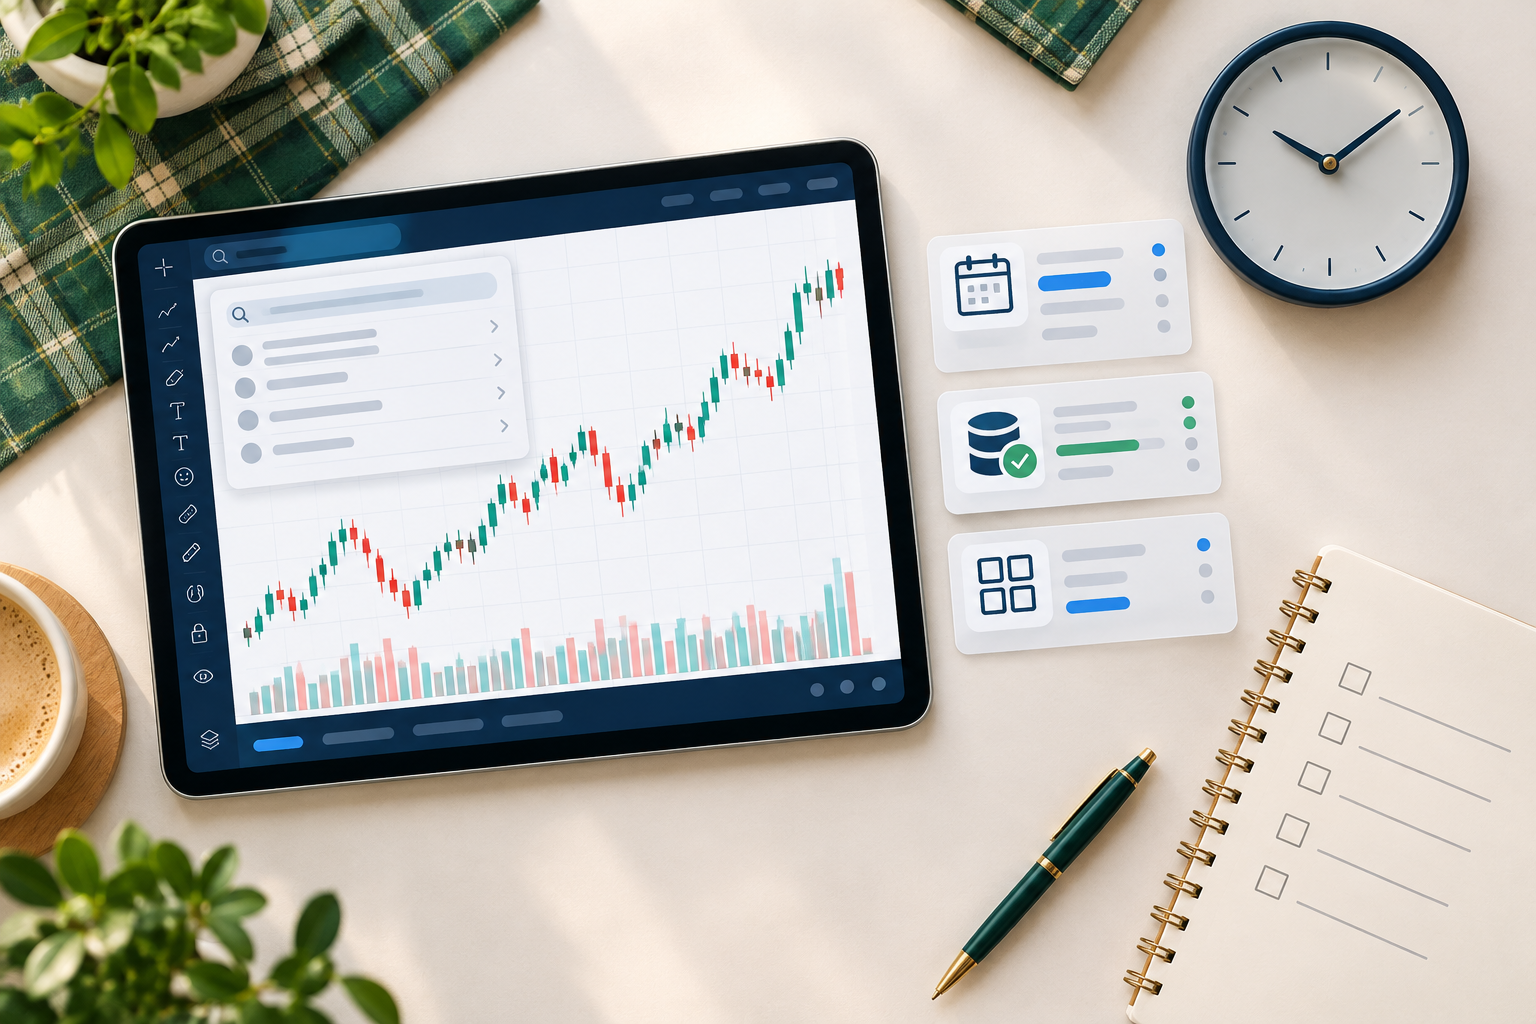
Use this sequence:
- Search for NASDAQ:QQQ and confirm the fund identity.
- Select ordinary candles and your working interval.
- Decide whether extended hours belong in the analysis.
- Open Indicators and add the built-in studies described below.
- Save the layout with the session choice in its name.
These are proposed workflow steps, not claimed performance settings.
QQQ's primary listing is Nasdaq, not NYSE. SPY is associated with NYSE Arca. NYSE, NYSE Arca, and Nasdaq labels help identify venues; they don't describe interchangeable data feeds. A NYSE menu entry isn't a reason to replace the Nasdaq instrument.
Searches such as “Nasdaq QQQ,” “QQQ Nasdaq,” and “ETF QQQ” should bring you back to the same verified fund page. “thinkmarkets qqq” and “qqq thinkmarkets” require another check: a broker-provided contract may have different sessions and pricing.
Why is the qqq tradingview chart not loading?
Check another symbol, reload the layout, then disable custom scripts. If built-in charts load but a script doesn't, investigate that program before blaming the exchange.
Confirm your connection and account permissions. Don't solve missing Nasdaq data by substituting an NYSE feed. The public symbol page is a useful comparison point.
Which 5 indicators do Nasdaq traders watch on a qqq tradingview chart?
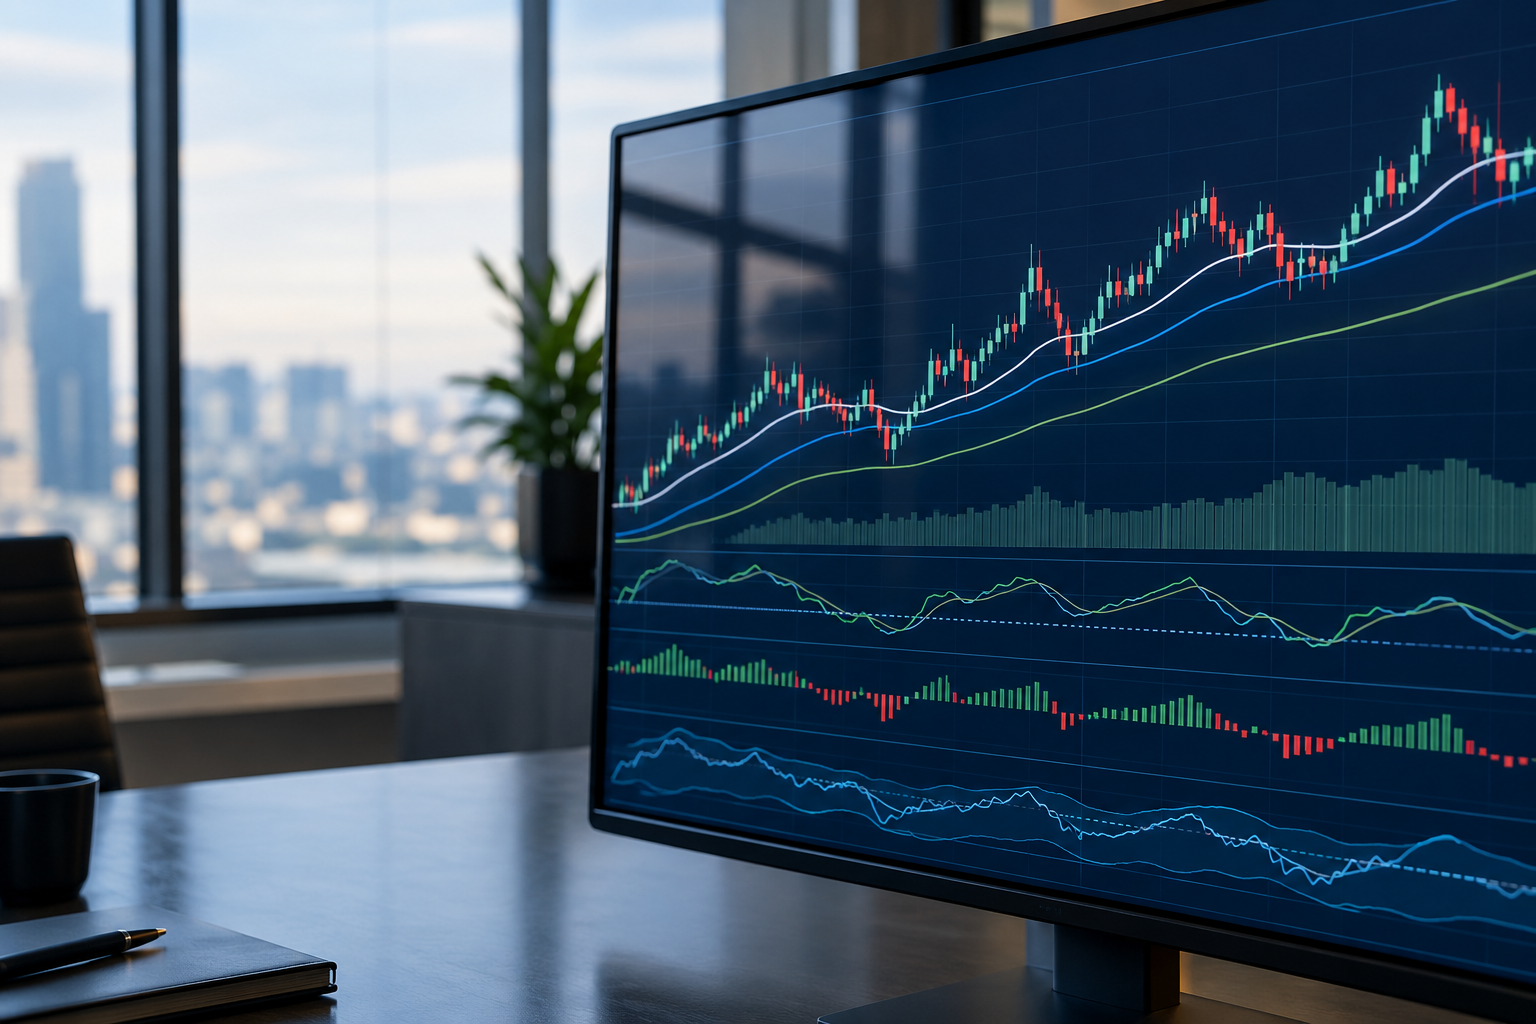
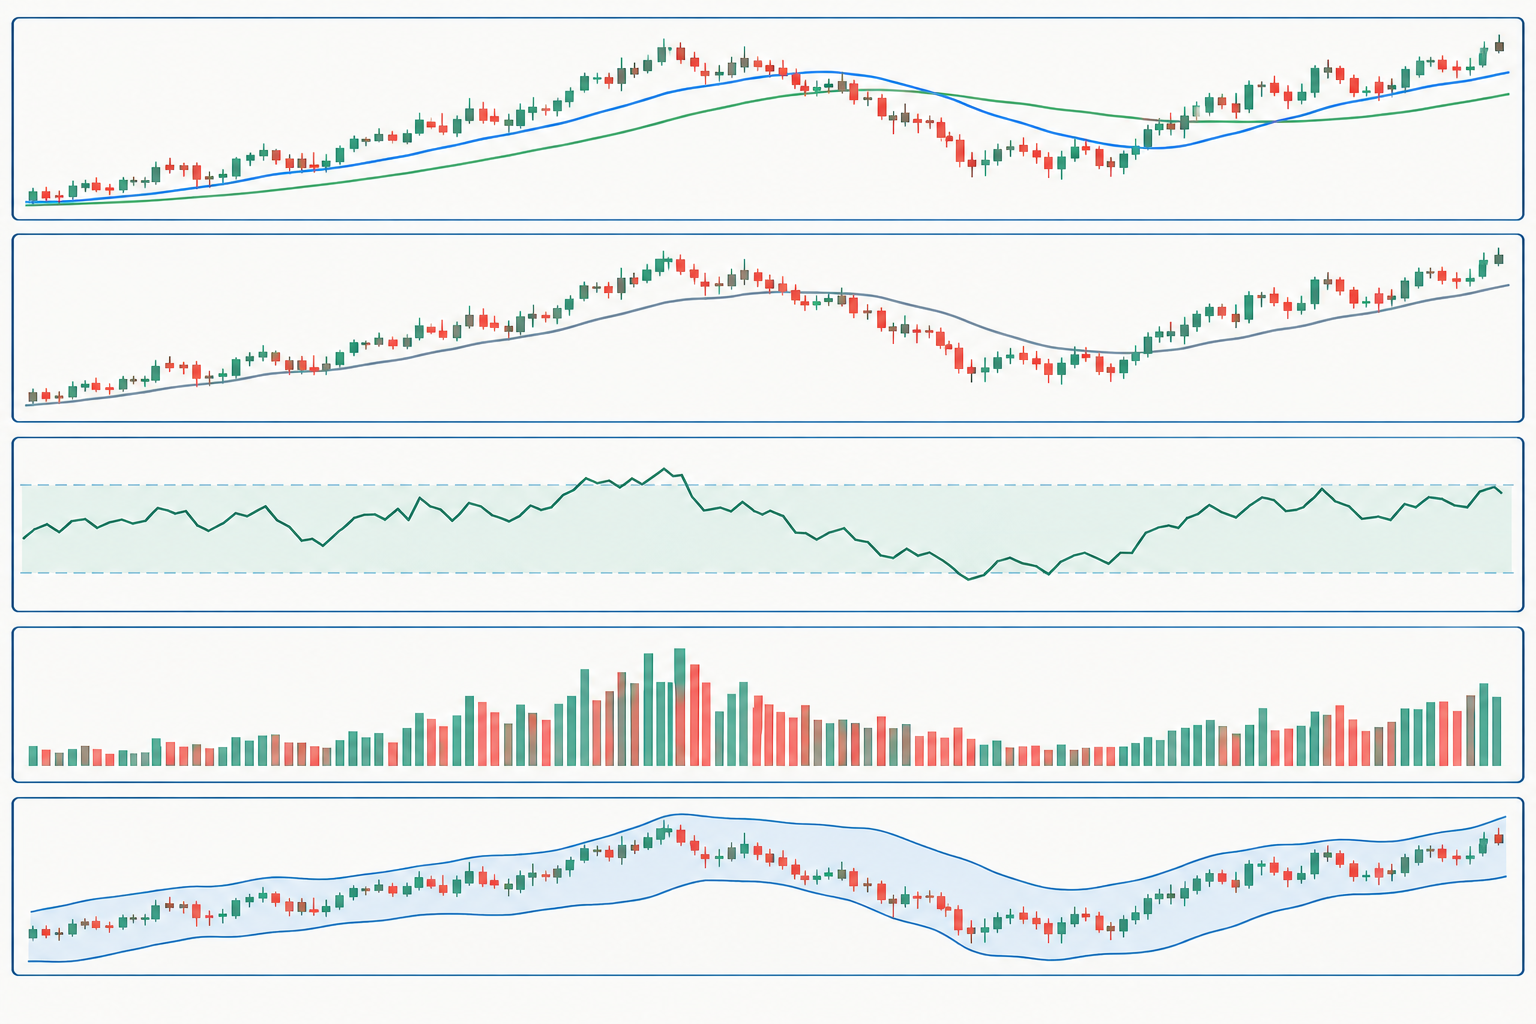
Use an EMA pair, session VWAP, RSI, volume, and ATR as a compact observation framework. These are proposed educational settings, not a backtested system, and agreement among them doesn't establish a profitable edge.
Exponential moving averages: which settings reveal trend?
Use 20- and 50-period EMAs as a starting proposal. The technicals page also tracks EMA lengths of 10, 20, 30, 50, 100, and 200, showing why “the moving average says buy” is incomplete without an interval.
On qqq tradingview, rising averages beneath candles describe an upward trend wave. Flat, tangled averages describe choppy tape. Wait for a pullback and inspect support and resistance, areas where buying or selling previously appeared.
A close below the faster average deserves attention, not an automatic short. The same settings describe different horizons on intraday and daily charts.
Drawback: EMAs react after movement begins. A sharp reversal can travel far before the trend filter changes.
Session VWAP: where has the session traded?
VWAP is the volume-weighted average price. Choose a session reset for intraday work; the line starts fresh with the selected session.
Watch whether an opening wave stays above VWAP or repeatedly crosses it. Repeated crossings often describe balance rather than a clean setup. A reclaim followed by a move back below the line can become a bull trap: a failed move that attracts late buyers.
VWAP isn't a floor. Its level depends on session settings and the underlying feed. Compare the instrument against the correct Nasdaq listing.
RSI: is momentum supporting the move?
Start with 14-period RSI, the length shown on TradingView's technicals page. RSI measures the balance of recent gains and losses; it doesn't measure whether the fund is fundamentally cheap.
For the qqq tradingview template, proposed reference lines are 30, 50, and 70. These are interpretation guides, not tested entry thresholds.
If a second wave reaches a higher high while RSI weakens, momentum has diverged. That warns you to inspect structure. It doesn't make an immediate short sensible. Public ideas frequently contain competing interpretations of the same chart.
Volume: did participation support the breakout?
Display volume bars with a proposed 20-bar average. Compare the breakout with recent participation, while remembering that the open and close naturally differ from midday.
A tight consolidation is a narrow pause. If the fund leaves that range with weak participation and returns below resistance, the move deserves less trust.
Don't confuse a closing rebalance surge with fresh conviction. Check the fund's holdings and the session context before telling a story about one bar.
ATR: how much room does the market need?
Use proposed 14-period ATR to track average true range, a volatility measure that accounts for gaps. ATR describes movement size, not direction.
When ATR rises, a fixed-dollar stop can become too tight. Place the stop loss beyond the structure that invalidates the idea, then reduce shares if that distance grows. Getting stopped out repeatedly isn't proof that the next wave owes you money.
The fund's reported high-low range provides broader context, but it isn't interchangeable with ATR.
| Indicator / purpose | Default vs suggested | Timeframe | Trader type |
|---|---|---|---|
| EMA / trend | Check script; suggest 20 + 50 | Intraday or daily | Day, swing |
| VWAP / session location | Check anchor; suggest session | Intraday | Day, scalper |
| RSI / momentum | Common 14; suggest 14 | Execution interval | Day, swing |
| Volume / participation | Check average; suggest 20 bars | Matched session | Day, swing |
| ATR / movement size | Common 14; suggest 14 | Risk horizon | Day, swing, position |
Which qqq tradingview setup fits each trader type?
Day traders need session context, while swing traders need daily structure and overnight risk controls. Scalpers depend more heavily on execution quality; long-term position investors should give fund composition and costs more weight than intraday indicator flips.
What is the best time frame for day trading?
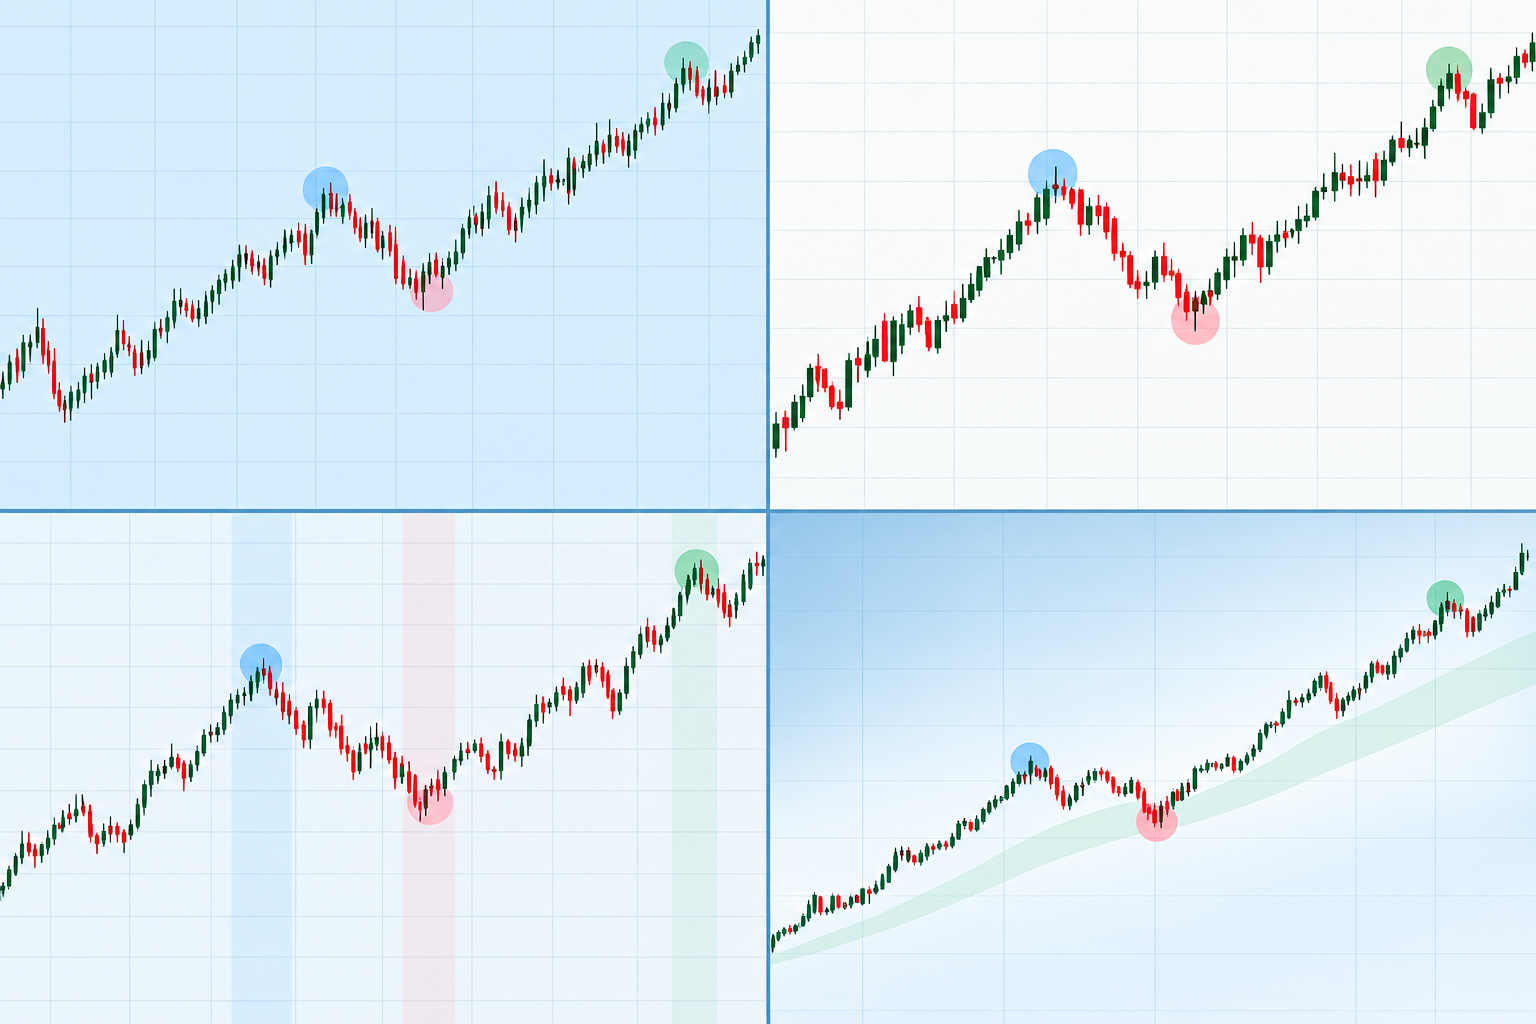
For qqq tradingview, start with a slower context view and one execution view. Proposed examples are hourly context with a five-minute execution chart; these are preferences to evaluate, not evidence-backed winners.
Keep both views on the same session. A broad upward wave can contain a sharp local decline. During power hour, the final regular-session hour, check whether participation confirms the move rather than assuming late activity predicts tomorrow.
How should swing traders read candlestick patterns?
Read candle location before candle names. A long lower wick near established support means something different from the same wick in the middle of a range.
For qqq tradingview swing work, mark the prior close, gap boundaries, and basing area. A gap fill means movement back through an opening gap; it isn't a market obligation. A gap below your stop can also produce a worse exit than planned.
Use the trade plan builder and position-size calculator to connect entry and exit distance to account risk. The swing-trading tools guide covers tools beyond charting.
How do you compare charts with Invesco QQQ Trust, Series 1?
Use percentage comparison for relative performance and a ratio view for relative strength. A qqq tradingview comparison should align dates, sessions, and dividend treatment before comparing the fund with another ETF.
For a QQQ SPY comparison, distinguish a Nasdaq growth-heavy index from SPY's broader large-company index exposure. Different sector weights can explain relative performance without supplying an entry signal.
NYSE Arca data and Nasdaq data should cover the same interval. If an NYSE-sourced comparison uses a different session, fix that before judging leadership.
Compare the basket with its largest stocks, too. Index strength supported by a narrow group can behave differently from broad participation. Check the fund holdings rather than guessing from the index candle.
Never transfer an index point level directly to an ETF price.
How should latest news and seasonals affect the setup?
News should change your risk preparation before it changes your indicator settings. Seasonals describe historical tendencies, not a promise that the market will repeat a calendar pattern.
News and more news from etf.com
Use the qqq tradingview news panel for discovery, then check the underlying report. A “More news from etf.com” label is a publishing route, not independent confirmation.
During earnings season, inspect announcements from heavily weighted stocks. The fund can move even when most constituents barely budge.
Key stats: return snapshot. September 2026 material reported a 22.08% year-to-date daily total return. That figure has a different meaning from a price-only change, and its measurement date must travel with it.
Don't anchor a 2026 tradingview plan to that past return. An overextended advance can pause without breaking its longer trend.
How should community forum ideas and technicals be filtered?
Treat community ideas as hypotheses with timestamps and invalidation conditions. A qqq tradingview forecast that lacks a risk boundary is an opinion, even if its chart looks expensive.
Wave labels aren't evidence by themselves. Ask whether the author published before the move, kept losing calls visible, and explained repainting, where past signals change after new bars arrive. Inspect the script program rather than trusting a creator program badge.
Search-result cleanup also matters. Literal navigation fragments can include:
community social network wall love refer friend creator program house rules moderators ideas trading education editors x27 picks pine script
That chain contains community social, social network wall, network wall love, wall love refer, love refer friend, refer friend creator, friend creator program, creator program house, program house rules, house rules moderators, rules moderators ideas, moderators ideas trading, ideas trading education, trading education editors, education editors x27, editors x27 picks, x27 picks pine, and picks pine script.
Discard those fragments from market analysis. The same applies to illustrative broken exports such as x27 buy x27, x27 sell x27, x27 neutral x27, x27 fund x27, x27 index x27, x27 market x27, x27 price x27, x27 Nasdaq x27, x27 NYSE x27, x27 news x27, and x27 chart x27.
An amp fragment is formatting debris: stocks amp etfs, price amp volume, fund amp index, Nasdaq amp NYSE, news amp ideas, charts amp alerts, and risk amp return. None measures demand.
Top 5 TradingView features for QQQ traders
The most useful qqq tradingview features reduce repeated work: saved layouts, comparison charts, alerts, replay, and script inspection. They help organize observation without making predictions more reliable.
- Saved layouts: keep the watchlist and sessions consistent.
- Compare charts: check relative movement.
- Alerts: return attention to a chosen level.
- Replay: review decisions without seeing later candles.
- Pine inspection: understand a program before depending on it.
Menu strings such as “Supercharts Screeners Stocks ETFs,” “Bonds Crypto,” “CEX,” “DEX,” “Pine Heatmaps Stocks ETFs,” and “Calendars Economic Earnings Dividends” describe navigation. Crypto coins aren't needed for this ETF workflow.
Likewise, “Copyright,” “Made,” “English English Select,” and “Select” aren't market inputs. Provider or rights notices may mention ICE Data Services, FactSet, FactSet Research Systems Inc, American Bankers Association, CUSIP Database, SEC, Quartr, or TradingView, Inc. The words “research systems inc” identify an organization, not verified investment advice.
Free vs paid: what deserves your money?
Pay only when a documented layout, alert, or indicator limit blocks your process. Exchange data can involve separate permissions or charges.
Two real drawbacks are recurring subscription costs and analysis paralysis from excessive choices. Check the TradingView plan-limit breakdown before buying.
How does TradingView compare to competitors?
Choose by workflow rather than screen density. TradingView suits cross-device chart review; broker platforms can suit traders who want charting close to order entry.
Thinkorswim deserves consideration for broker-linked analysis; TrendSpider for automated technical workflows; TC2000 for scanning and chart lists; Webull charts for an integrated broker interface. Verify regional availability and current features before committing.
Use the TradingView versus Finviz comparison if screening matters more than chart detail, or the TrendSpider backtesting guide if historical rule evaluation is the missing step.
No competing platform changes what the underlying fund owns.
How do you set qqq tradingview alerts?
Create alerts around a defined condition, then match their timing to your decision rule. For candle-based analysis, a confirmed-close alert helps avoid reacting to a condition that disappears before the bar finishes.
Mark the relevant level, select the alert condition, inspect the interval, and choose a notification channel. Name the alert with the symbol and intended action: review, not buy.
For qqq tradingview, an alert should send you back to the setup. Check location, participation, and available risk-reward before acting. Automatic technical ratings aggregate calculations; they don't know your account or stop distance.
Can you trade QQQ on TradingView?
Order entry depends on your connected broker, account permissions, region, and instrument support. Seeing a fund chart doesn't establish that you can transact through your account. Confirm the contract identity and execution feed before submitting anything.
Frequently asked questions about qqq tradingview
The answers below separate chart interpretation from investment decisions. Current returns and valuations require a dated fund report; technical ratings alone cannot establish suitability.
Is QQQ a strong buy now?
A technical “buy” label cannot establish that QQQ is a strong buy for you. The answer depends on your horizon, existing concentration, valuation tolerance, and loss capacity. On qqq tradingview, use technicals to describe conditions, then write an invalidation rule. This guide does not provide a current recommendation.
What if I invested $1 000 in QQQ 10 years ago?
The exact result depends on the purchase date, end date, dividend reinvestment, and taxes. Multiply $1,000 by the fund's total-return growth factor across that decade. Don't use a price-only chart to claim a reinvested result. A verified September 2026 trailing-decade figure isn't established by the source snapshots used here.
Is it better to buy QQQ or voo?
VOO generally fits investors seeking broader large-company sector exposure; QQQ fits investors deliberately accepting more Nasdaq growth concentration. Neither removes equity risk. Review overlap before owning both, because buying another fund doesn't necessarily add different businesses. Your allocation should reflect the concentration you can tolerate through a prolonged decline.
What is the 10 year average return on QQQ?
The answer changes with the ending date and the definition of average. Annualized total return measures compounded growth, while an arithmetic average simply averages yearly returns. Use a dated fund performance report and specify reinvestment. This article does not invent a current trailing-decade percentage from an undated chart.
How accurate are TradingView QQQ predictions?
There is no single accuracy rate for TradingView forecasts. Public ideas, technical ratings, and custom programs use different rules and horizons. A credible evaluation needs signals recorded before outcomes, realistic costs, and unchanged rules. Treat community agreement as discussion rather than proof, and paper trade it first.
Can the same setup work for TQQQ or SQQQ?
The interface can display related ETFs, but copying the layout doesn't copy the risk. Products with daily multiplier or inverse objectives can behave differently over longer holding periods. Searches for TQQQ or SQQQ on TradingView require a fresh product check. Start with the ordinary fund profile as the comparison baseline.
References
These are the source pages used above. Live pages can change; snapshot figures are not independently refreshed quotes.
Nasdaq Qqq - https://www.tradingview.com/symbols/NASDAQ-QQQ/
ar.tradingview - https://ar.tradingview.com/scripts/qqq/
Powershares Qqqq - https://ng.investing.com/etfs/powershares-qqqq
Page 2 - https://il.tradingview.com/scripts/qqq/page-2/
Page 5 - https://www.tradingview.com/symbols/NASDAQ-QQQ/ideas//page-5/
Index - https://www.schwab.wallst.com/schwab/Prospect/research/etfs/schwabETF/index.asp?type=holdings&symbol=QQQ
Holdings - https://finance.yahoo.com/quote/QQQ/holdings/
stockrover - https://www.stockrover.com/html_reports/QQQ/
Technicals - https://www.tradingview.com/symbols/NASDAQ-QQQ/technicals/
seekingalpha - https://seekingalpha.com/symbol/QQQ
Alpha Score: TradingView assessment
TradingView's FullStack Alpha Score is 95/100, with the pillar split below labeled provisional. The assessment favors chart quality and community breadth while treating subscription value as the weakest relative category.
Signal Quality: 19/20 · Transparency: 19/20 · Price-to-Value: 18/20 · Usability: 19/20 · Community Verdict: 20/20.
These scores reference the FullStack Alpha TradingView review. The score comes from FullStack Alpha desk research plus public user sentiment.
Conclusion
Save one qqq tradingview template, document each indicator's purpose, and rehearse the workflow before risking capital. If an indicator never changes a decision, remove it.
Use alerts to reduce screen time and a written risk limit to prevent revenge trading. FullStack Alpha, sometimes searched as “full stack alpha,” favors a repeatable process over another blinking dashboard.
Compare tools by job and cost in the FullStack Alpha AI stock tools directory.
Affiliate disclosure: This article may contain affiliate links; FullStack Alpha may earn a commission at no extra cost to you.
We test the tools. You get the verdict.
One email a week. What we tested, what scored, and what we'd skip. Written for traders, not for clicks.
More from FullStack Alpha