

TrendSpider Backtesting: The Engine Most Traders Never Run
Short on time? The TrendSpider Alpha Score scorecard breaks the 92/100 down by pillar, with pricing and the verdict, in about 90 seconds.
See the score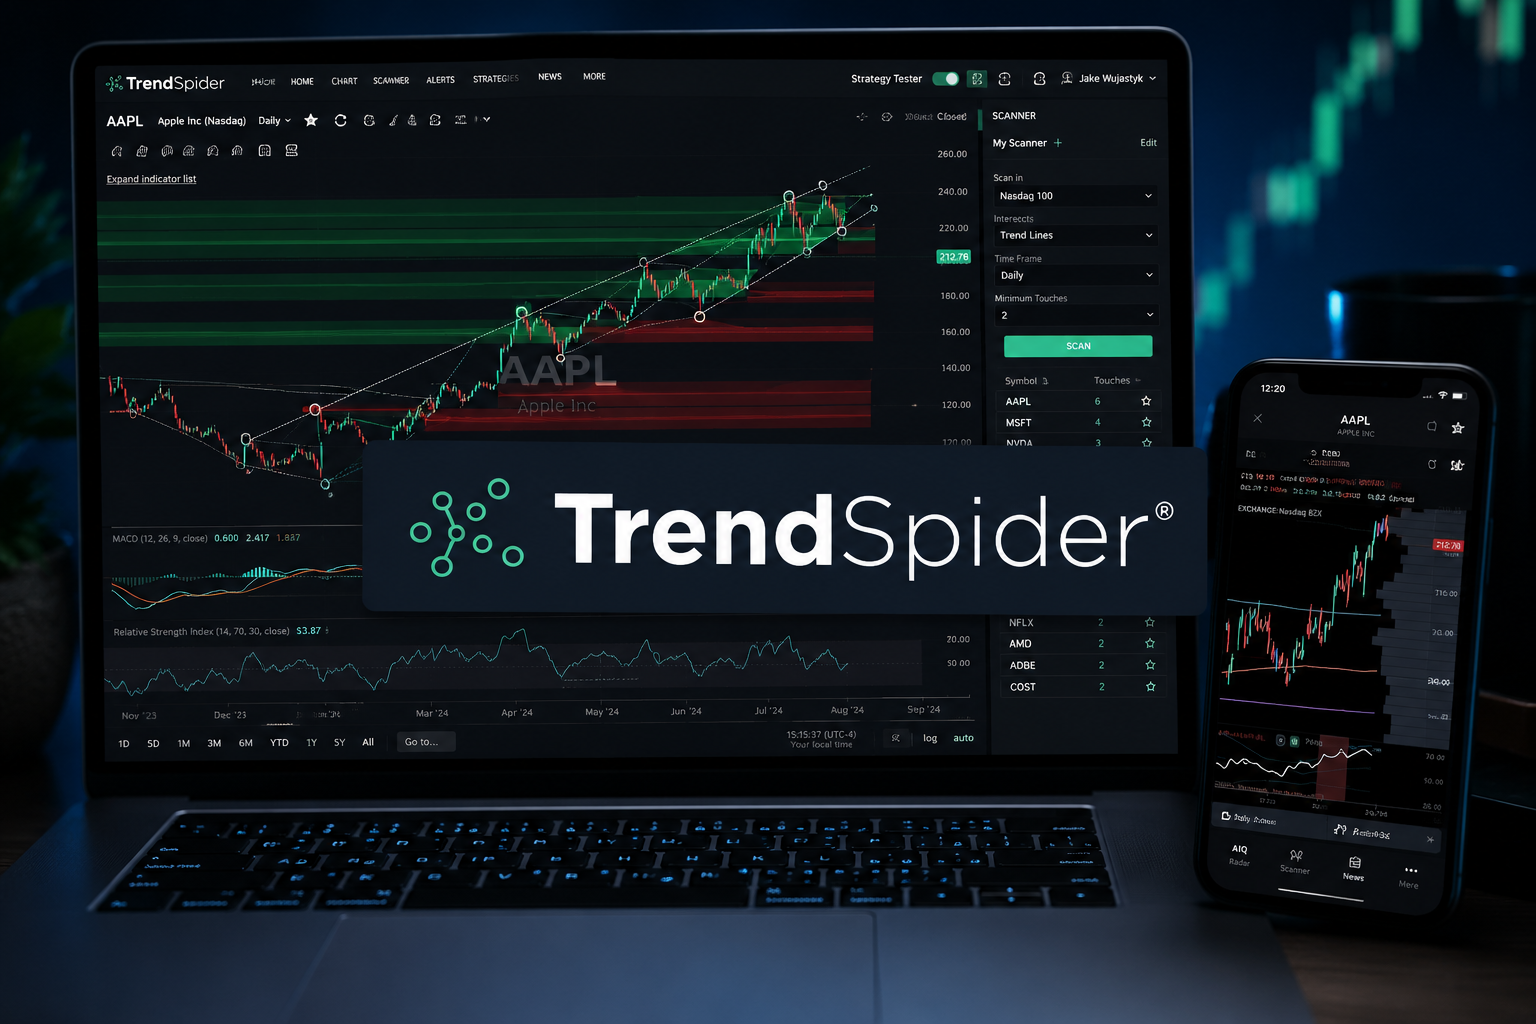
Punchline: This TrendSpider review finds the backtesting engine is genuinely functional and no-code, but it's locked behind a tier most subscribers don't buy, and the setup work required to define real entry and exit rules stops the majority of users before they ever run a single test.
Key Takeaways
- Standard tier backtests at a 2-hour minimum interval, intraday strategies cannot be tested at the resolution they actually trade; you need Enhanced or Advanced for 1-minute resolution
- Standard tier caps backtest depth at 2,000 bars, roughly 5-6 months of daily data, too shallow for multi-year strategy validation; Enhanced and Advanced extend to 10,000 and 30,000 bars respectively
- Active alerts scale by tier: Standard gets 10 active alerts with 30-day expiry; Advanced gets 100 active alerts with 180-day expiry
- The Alpha Score is 92 out of 100, Signal Quality 19/20 and Usability 19/20 lead; Price-to-Value at 17/20 is the weakest pillar, reflecting real cost at the tiers where the engine becomes genuinely useful
- Enhanced tier ($107.31/month) is where TrendSpider becomes the tool the marketing describes, 1-minute backtest resolution, 10,000 bars of depth, and full scanner access
- Who should not buy: Traders who want a passive screener, anyone unwilling to spend time defining precise entry and exit rules, or anyone on a tight budget expecting the Standard tier to deliver institutional-grade backtesting
TrendSpider Review: What Does the Backtesting Engine Actually Do?
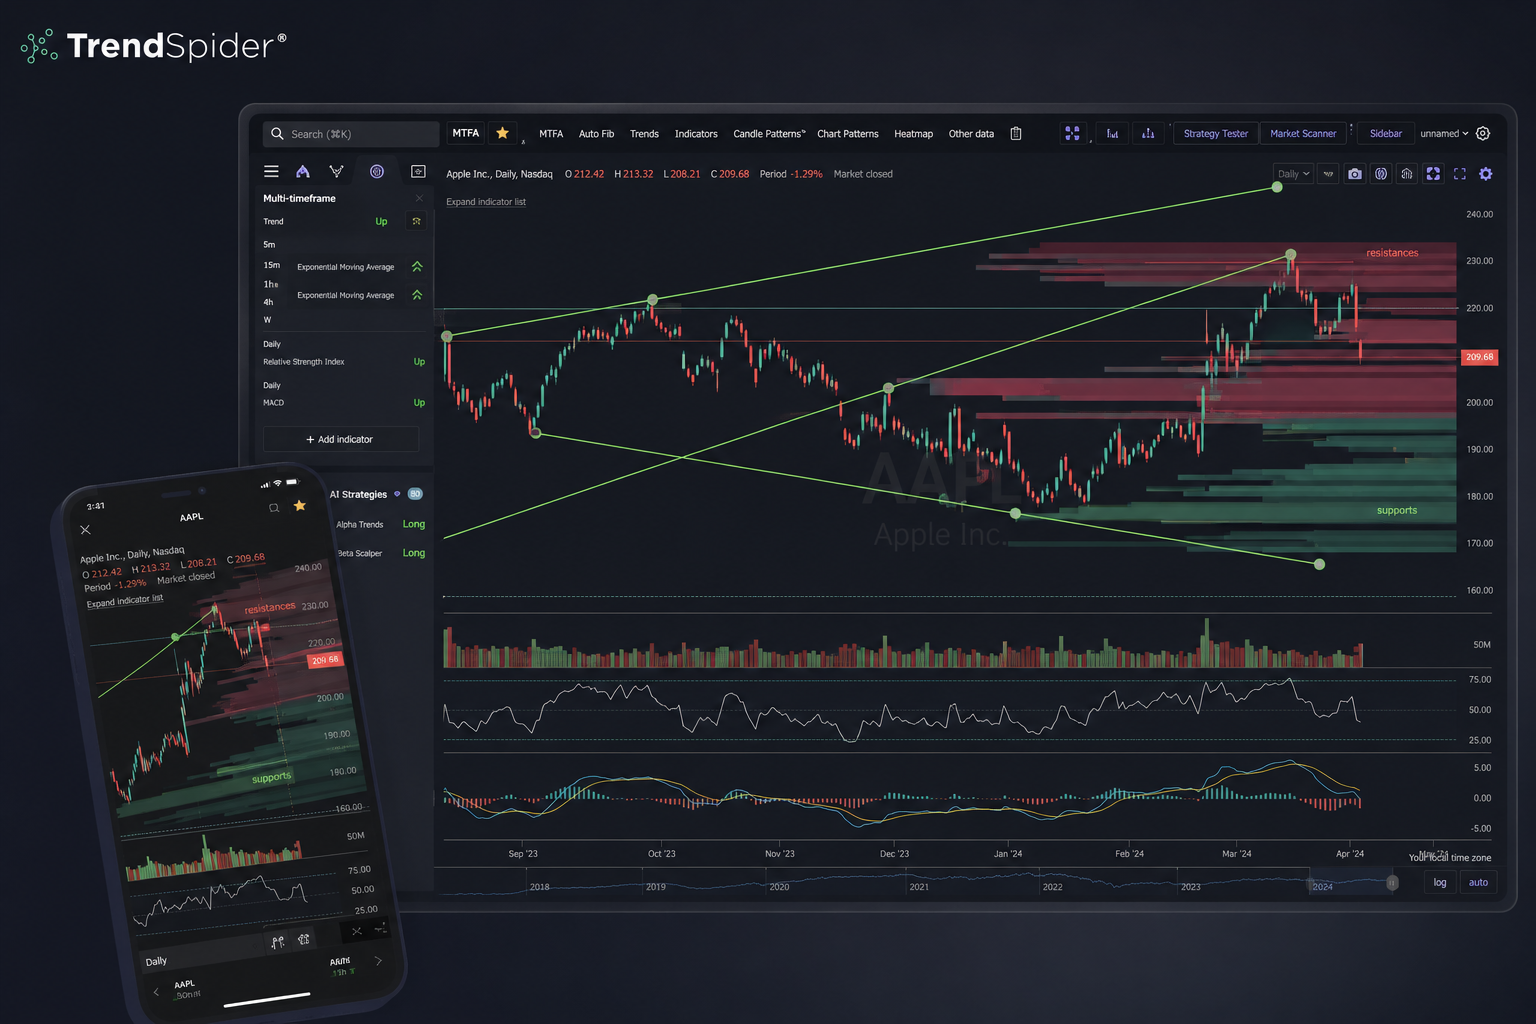
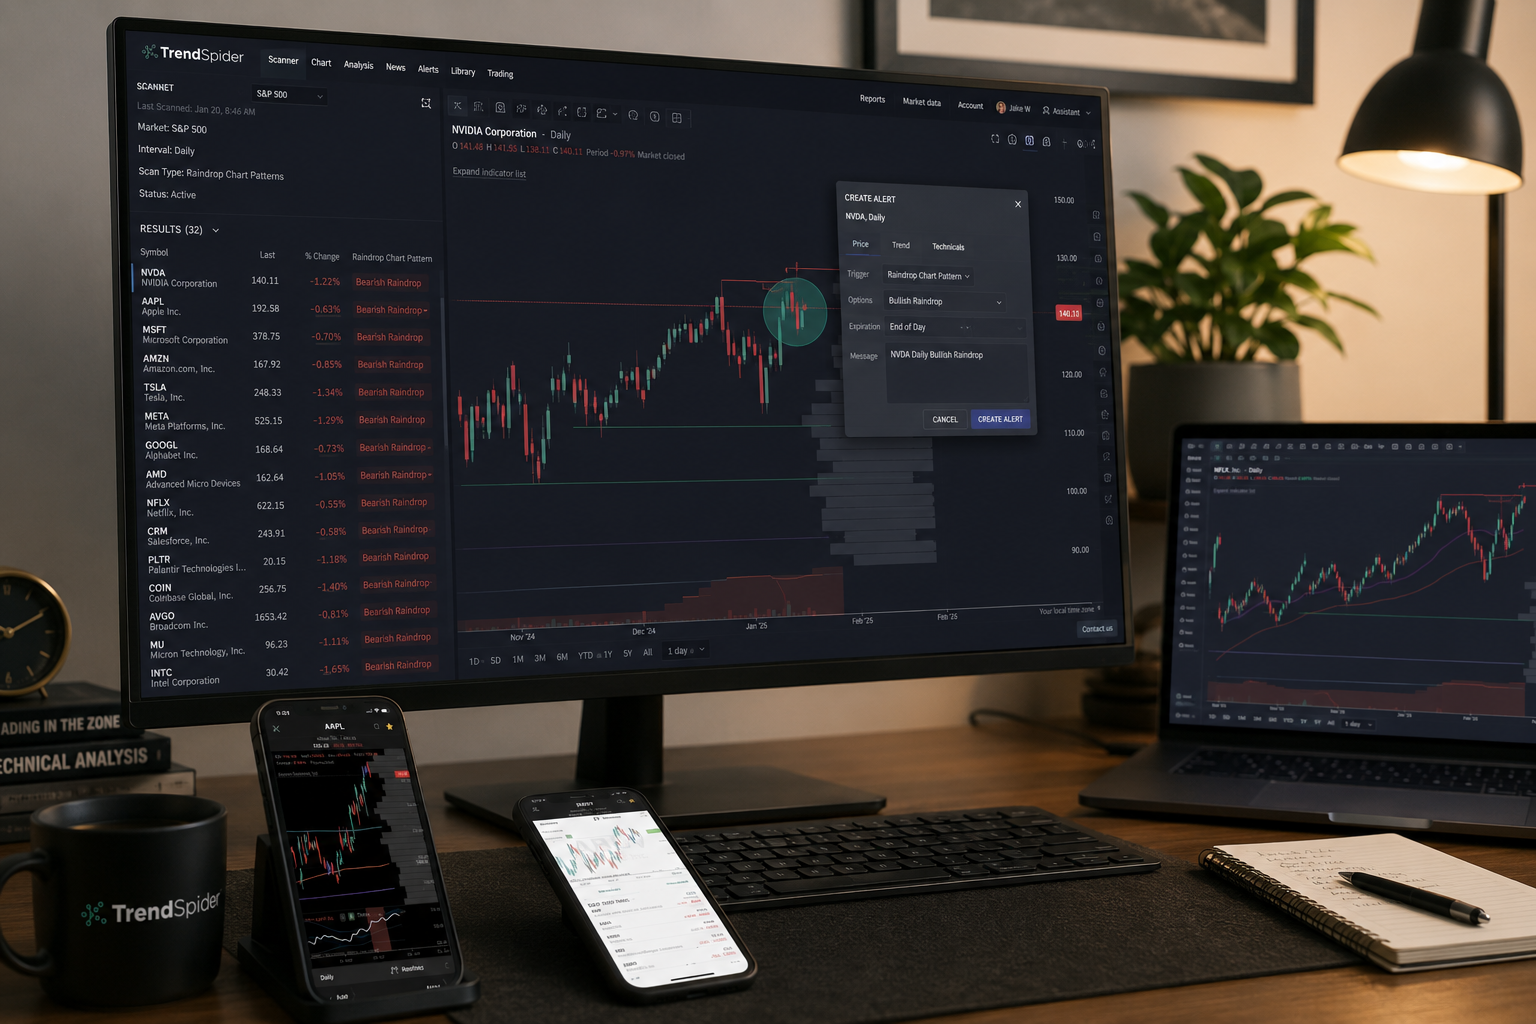
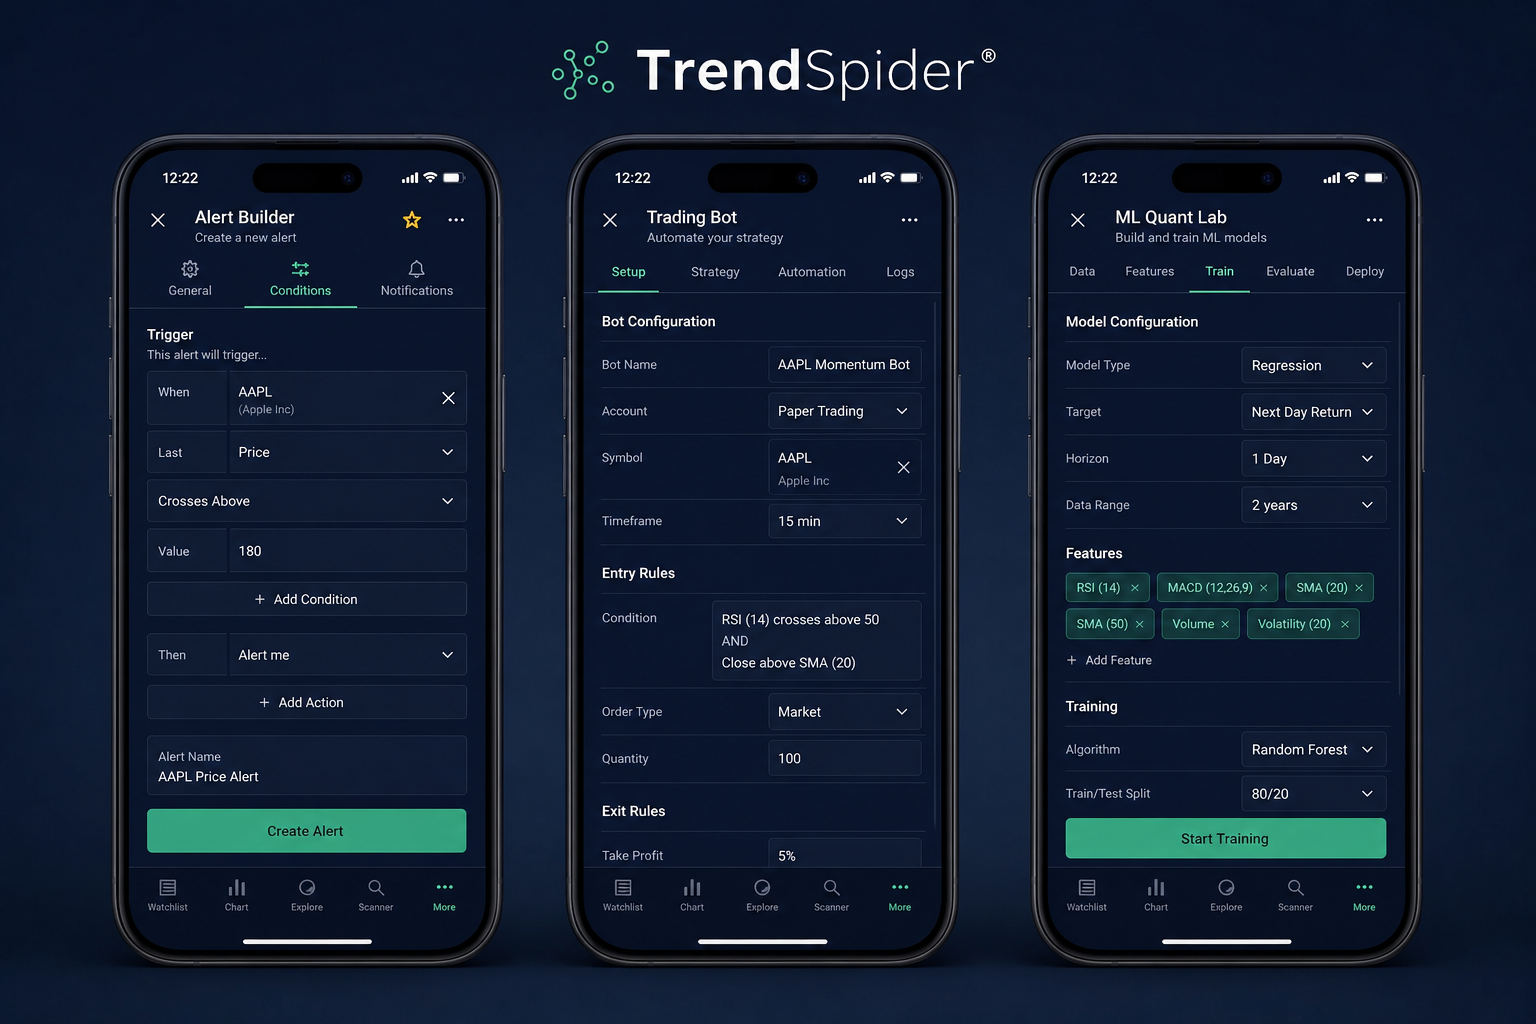
TrendSpider's backtesting engine lets you test a rule-based trading strategy without writing a single line of code. You define your entry conditions, exit conditions, and position sizing rules using a visual interface, and the engine runs those rules against historical price data to show you how the strategy would have performed.
That's the short version. Here's what it actually produces.
When you run a backtest in TrendSpider, the output includes a full equity curve, total return, win rate, average win versus average loss, maximum drawdown, and a trade-by-trade log. You can see exactly which entries triggered, which exits fired, and where the strategy bled. That's a real strategy test, not a screener result dressed up with a green arrow.
The distinction matters. A screener tells you which stocks currently meet a set of conditions. A backtesting engine tells you whether acting on those conditions historically produced a profitable outcome. Those are different questions, and most charting platforms only answer the first one. TrendSpider answers both.
The no-code part is the genuine differentiator. Building a strategy test in Pine Script on TradingView requires you to write actual code, variable declarations, conditional logic, function calls. If you're not a programmer, the learning curve is steep enough that most traders never finish their first script. TrendSpider's Strategy Tester uses a condition builder: you select an indicator, choose a comparator, set a value, and add the rule. It reads like a sentence. "RSI crosses above 30 AND price is above the 50-day moving average" is a few clicks, not a function.
The output is readable if you know what to look for. A high win rate with a poor average win-to-loss ratio is a warning sign, the strategy wins often but gives back too much on losers. A low win rate with a strong average winner can still be profitable if the math holds. TrendSpider shows you both numbers. What it doesn't do is tell you whether the strategy is overfit to the historical period you tested. That part is on you.
Why Do Most Traders Never Run a Real Backtest?
This is the section that pays off the headline. The backtesting engine works. The reason most subscribers never use it properly has nothing to do with the software and everything to do with three specific friction points, two of them baked into the pricing structure and one that's purely human.
Reason 1: The Standard Tier Tests at a 2-Hour Minimum Interval
If you're trading intraday setups, 5-minute breakouts, 15-minute momentum entries, opening range plays, the Standard tier cannot test them at the resolution you actually trade. The minimum backtest interval on Standard is 2 hours. That means the engine can only evaluate whether your entry condition was true at the open of a 2-hour bar, not at the 5-minute candle where you'd actually pull the trigger.
This isn't a minor limitation. It's a structural mismatch between what the tier costs and what day traders need. You're not testing your strategy. You're testing a coarser approximation of it. The results will not translate.
The fix is moving to Enhanced or Advanced, both of which drop to a 1-minute minimum interval. That's where intraday backtesting becomes real.
Reason 2: Standard Caps Backtest Depth at 2,000 Bars
Two thousand bars of daily data covers roughly 8 years if you're testing daily charts. That sounds fine until you realize most traders want to test across multiple market regimes, a bull run, a correction, a sideways chop period, a crash. Eight years of daily data might catch two or three of those. But 2,000 bars of 1-hour data covers about 10 months. And 2,000 bars of 15-minute data covers less than 3 months.
For any intraday strategy, 2,000 bars is not enough to draw a statistically meaningful conclusion. You need to see the strategy perform across hundreds of setups in different market conditions, not dozens. Enhanced tier extends depth to 10,000 bars. Advanced goes to 30,000. Those numbers matter.
Reason 3: Most Users Stop at the Setup Work
Here's the human problem. Defining exact entry and exit rules is harder than it sounds. Most traders have a loose mental model of how they trade, "I buy when it breaks out of consolidation with volume", but translating that into a precise, testable rule set requires specificity that forces you to confront how vague your actual process is.
What counts as "consolidation"? How many bars? What's the volume threshold, 1.5x average? 2x? What's your stop placement, below the consolidation low, a fixed percentage, an ATR multiple? What's your target, a fixed R multiple, a resistance level, a trailing stop?
Most traders hit this wall in the first session and close the Strategy Tester. That's not a TrendSpider problem. It's a process problem the software exposes. The fix is to paper trade it first with explicit rules, then test what you actually did.
The Tier Where the Engine Becomes Genuinely Useful
Say it plainly: Enhanced tier is the minimum viable plan for serious backtesting. At $107.31/month, it gives you 1-minute resolution, 10,000 bars of depth, and full scanner access. Standard at $52.38/month is a capable charting and scanning tool. It is not a serious backtesting platform for intraday traders.
A screener is not a strategy. TrendSpider's scanner can surface stocks meeting your conditions right now. The Strategy Tester tells you whether acting on those conditions has historically worked. Both tools live in the same platform. Most subscribers use one and ignore the other.
What Makes TrendSpider One of the Best AI Stock Tools?
TrendSpider earns its AI label in specific, verifiable ways, not through vague "machine learning" marketing copy. Here's what the AI actually does, and where it stops.
Machine Learning Trendlines and Support/Resistance Heatmaps
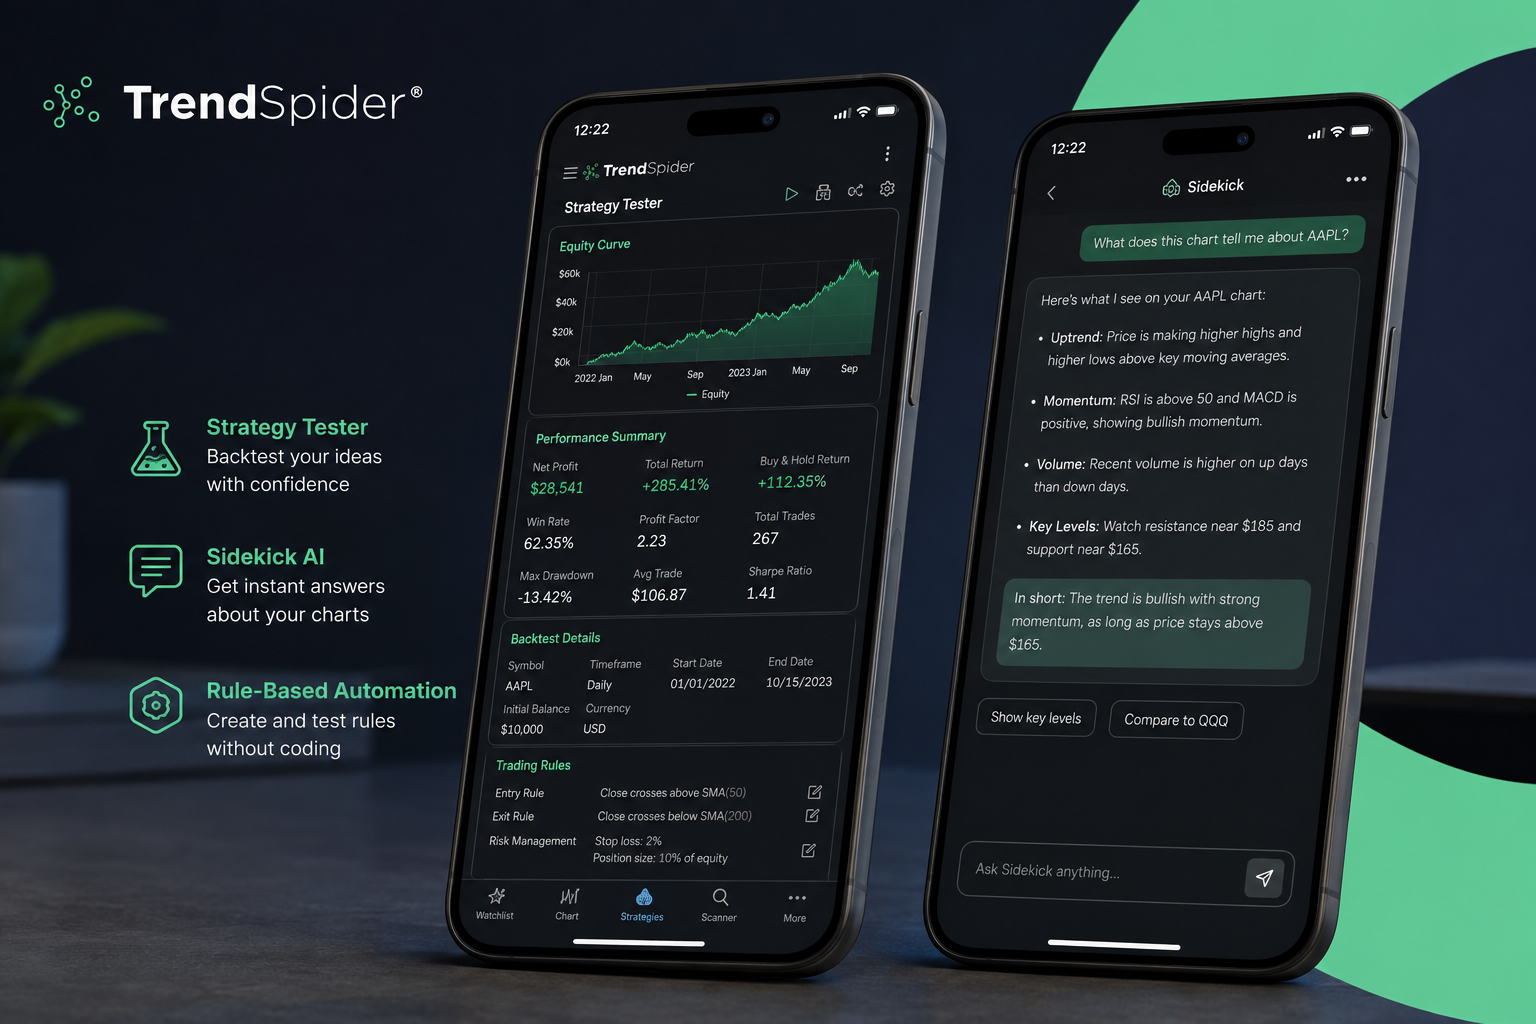
The most immediately visible AI feature is automated trendline drawing. On a traditional charting platform, you draw trendlines by hand, you pick two points, drag a line, and decide whether it matters. TrendSpider's algorithm scans the price history, identifies statistically significant pivot points, and draws the trendlines that best fit the data. It also generates support and resistance heatmaps: zones where price has historically reacted, weighted by the number of touches and the recency of those touches.
The practical value is speed and consistency. You're not missing a trendline because you didn't notice a pivot three months ago. The algorithm sees the whole chart at once and weights the levels by significance. Traders in r/RealDayTrading have noted this directly:
"they have automated trendlines and support/resistance heatmaps that are done based on machine learning algorithms... Trendspider's scanners are also second to none IMO too.", r/RealDayTrading
What the AI does not do: it does not predict which level will hold. It identifies where levels exist. Whether price respects them on the next approach is still a probability question, not a certainty. Any platform claiming otherwise is selling you something.
Sidekick AI: Plain Language Over Your Chart
TrendSpider Sidekick is a conversational AI layer built directly into the platform. You can ask it questions about what you're looking at, "What's the trend on this chart?" "Is there a pattern forming here?" "What do these volume spikes indicate?", and get plain-language responses without leaving the chart.
This is genuinely useful for traders who are still building their technical vocabulary, and it's a reasonable second opinion for experienced traders who want a quick read before digging deeper. What Sidekick is not: a prediction engine. It summarizes what the chart shows. It does not tell you whether the stock will go up. If you're expecting it to call winners, you'll be disappointed and you'll have misunderstood what it's for.
The AI coding assistant is a separate feature worth noting. It can build custom indicators in JavaScript from a natural language description. Describe what you want in plain English, and the assistant generates the code. That's a real time-saver for traders who know what they want but can't write the syntax.
As one trader in r/Daytrading put it:
"Love TV and I code a lot on it, but the AI functions and machine learning capabilities of Trendspider are intriguing", r/Daytrading
Pattern Recognition and Automated Chart Pattern Detection
TrendSpider scans for chart patterns, flags, pennants, head and shoulders, wedges, triangles, automatically, across the symbols in your watchlist or scanner results. The pattern detection runs on the same ML infrastructure as the trendline drawing. You're not manually hunting for formations across 50 charts. The platform flags them and you decide whether the setup is worth acting on.
This is where the scanner and the charting tools work together. You can screen for stocks in a tight consolidation with a specific pattern forming, then pull up the chart with automated trendlines already drawn. That's a workflow that would take significantly longer on a platform where every step is manual.
Dynamic Alerts That Fire on Conditions, Not Static Prices
Standard price alerts are binary: price hits $X, you get a notification. TrendSpider's dynamic alerts fire when a condition is true, "RSI crosses above 30 on the 4-hour chart while price is above the 200-day moving average." That's a fundamentally different tool. You're not watching a price level. You're watching for a setup.
Alert counts scale with tier: 10 active alerts on Standard, up to 100 on Advanced. For traders running multiple setups across multiple symbols, the alert count on Standard fills up fast.
Which TrendSpider Features Justify the Subscription?
Not every feature in TrendSpider is equally useful, and not every feature is available at every tier. Here's the honest mapping.
The Scanner: Not a Screener
The TrendSpider scanner is worth distinguishing from a basic stock screener. A screener filters by static criteria, price above $10, volume above 500,000, RSI below 30. The TrendSpider scanner can filter by dynamic technical conditions: stocks where price just crossed above a machine-learning trendline, or where a pattern just completed, or where the multi-timeframe trend alignment just shifted. That's a different level of specificity.
Traders in the Reddit community have called TrendSpider's scanners "second to none." The scanner is available across tiers, but the depth and speed of results improve at higher plans. For swing traders building a watchlist from a universe of several thousand stocks, this is one of the platform's strongest features.
For more on how AI-powered scanners compare to traditional filters, the breakdown at aistockpickerapps.com/blog/ai-stock-screeners-vs-the-old-filters-you-re-still-wasting-time-on is worth reading alongside this review.
Multi-Timeframe Analysis on One Chart
This is a feature that sounds like a minor convenience until you've used it. Most charting platforms require you to open four separate chart windows to view a stock on the daily, 4-hour, 1-hour, and 15-minute timeframes simultaneously. TrendSpider renders multiple timeframes on a single chart, with each timeframe's indicators and levels displayed together. You can see whether the daily trend, the 4-hour momentum, and the 15-minute entry signal are all aligned without toggling between windows.
For swing traders and day traders who use top-down analysis, start on the daily, confirm on the 4-hour, enter on the 15-minute, this is a genuine workflow improvement.
Raindrop Charts and Seasonality Tools
Raindrop charts are TrendSpider's proprietary visualization: they combine price action and volume data into a single candle-like display that shows where volume was concentrated within a given period. It's a different way to read the tape, and some traders find it more informative than standard candlesticks for identifying where institutional activity clustered.
Seasonality tools show historical performance patterns by month, week, or day of year. For swing traders who factor seasonal tendencies into their setups, earnings season positioning, end-of-quarter flows, this is a useful data layer. It's not available on every competing platform at this price point.
Trading Bots and Alert Automation by Tier
Trading bots, automated execution based on your alert conditions, are available on Enhanced and above. On Standard and Premium, you get alerts but not automated execution. This matters for traders who want to automate entries and exits rather than monitor alerts manually.
The bot functionality connects to supported brokers. It's not algorithmic trading in the institutional sense, you're executing rule-based orders, not running a latency-sensitive strategy. But for swing traders who want to automate a defined setup without sitting at a screen all day, it's a real capability.
Entry-tier features (Standard): Automated trendlines, support/resistance heatmaps, scanner, basic alerts, multi-timeframe analysis, Sidekick AI, Raindrop charts, seasonality tools.
Gated features (Enhanced and above): 1-minute backtest resolution, 10,000+ bars of depth, trading bots, higher alert counts, extended alert expiry.
The full picture on AI trading platforms is available at aistockpickerapps.com/ai-trading-platforms if you want to see how TrendSpider sits in the broader landscape.
TrendSpider Pricing by Tier: Backtesting Capability Comparison
Verify all figures at trendspider.com/pricing before subscribing. Prices shown reflect annual billing.
| Feature | Standard | Premium | Enhanced | Advanced |
|---|---|---|---|---|
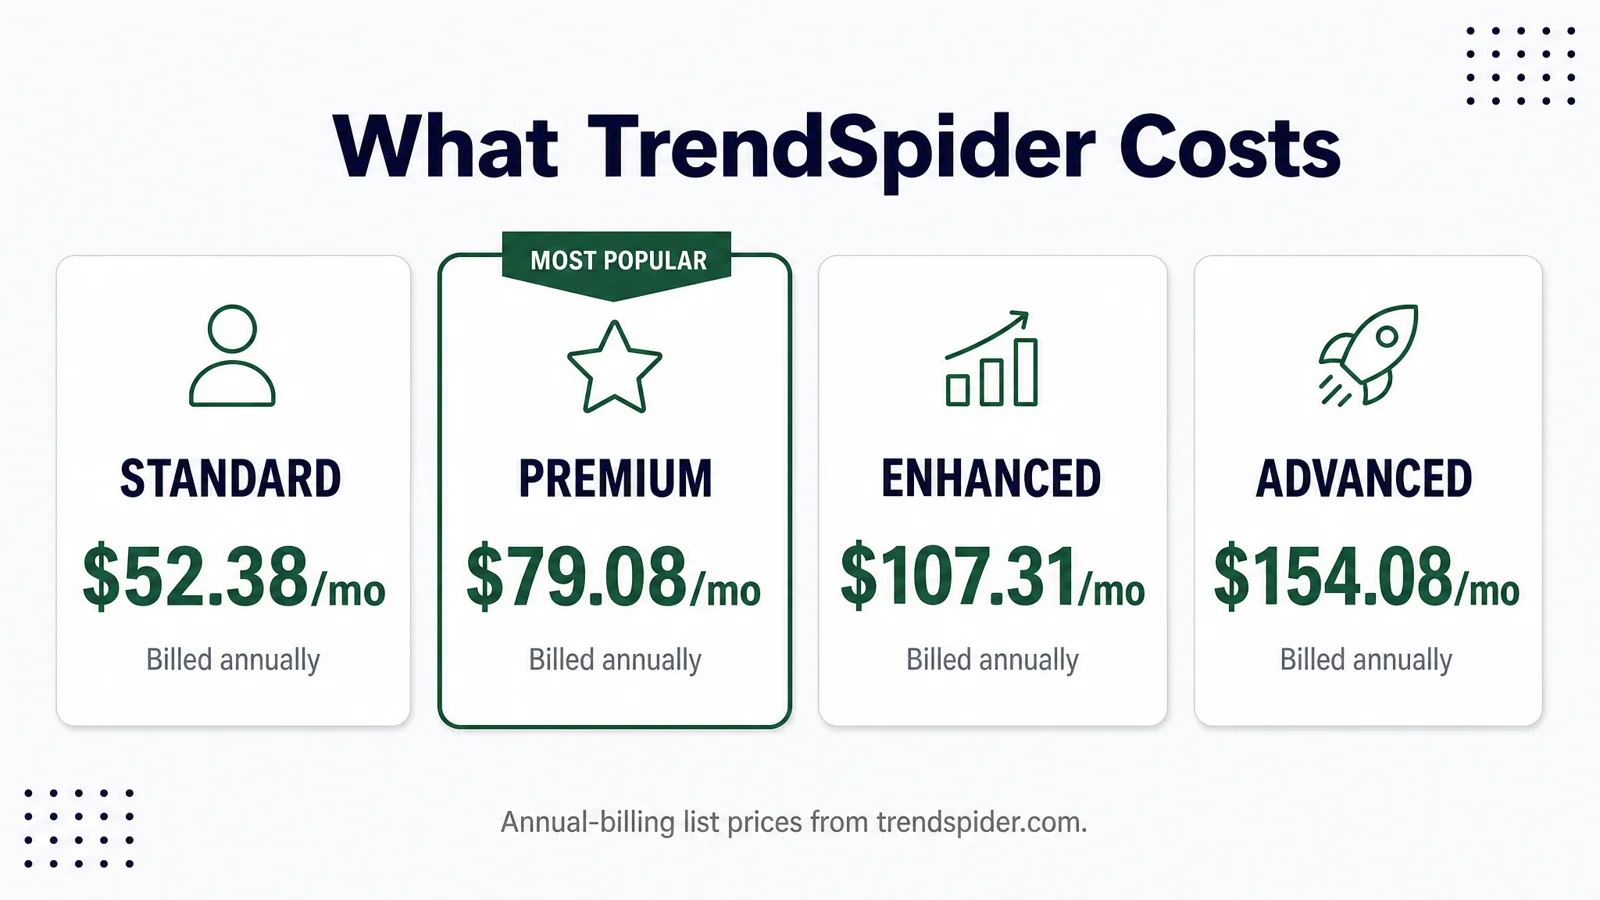
| Monthly price (annual billing) | $52.38/mo | $79.08/mo | $107.31/mo | $154.08/mo |
| Min. backtest interval | 2 hours | 1 hour | 1 minute | 1 minute |
| Backtest depth (bars) | 2,000 | 5,000 | 10,000 | 30,000 |
| Active alerts | 10 | 25 | 50 | 100 |
| Alert expiry | 30 days | 60 days | 90 days | 180 days |
| Trading bots | No | No | Yes | Yes |
Source: trendspider.com/pricing.
The jump from Standard to Enhanced is the meaningful one for backtesting. Premium improves depth and resolution modestly but doesn't unlock the 1-minute interval that intraday traders need. Enhanced does.
TrendSpider vs TradingView: Which One Backtests Better?
TrendSpider backtests better for traders who don't code. TradingView backtests better for traders who do.
That's the honest answer, and it's worth unpacking.
Where TrendSpider wins: The no-code Strategy Tester is genuinely more accessible than Pine Script. If you want to test a rule-based strategy without learning a programming language, TrendSpider's condition builder gets you there faster. The automated drawing tools, trendlines, support/resistance heatmaps, pattern detection, mean your charts are analysis-ready without manual setup. The scanner depth, particularly for technical conditions, is stronger than TradingView's built-in screener for most users.
Where TradingView wins: The Pine Script community library is enormous. There are thousands of free, community-built indicators and strategy scripts available immediately. If you can code, or if someone has already coded what you need, TradingView's strategy tester is powerful and the platform costs significantly less at comparable tiers. TradingView also covers more asset classes, crypto, forex, international equities, with broader market data.
The practical split: if you're a technical trader who works from charts, doesn't code, and wants automated analysis with a real backtesting engine, TrendSpider at Enhanced tier is the stronger tool. If you code in Pine Script, have a specific indicator library you rely on, or need crypto and forex coverage, TradingView's value proposition is harder to beat.
This is a review, not a full head-to-head. The point is that TrendSpider's no-code backtesting is a genuine differentiator, not a marketing claim, for the trader who doesn't want to write code.
The Alpha Score Breakdown
TrendSpider scores 92 out of 100 on the FullStack Alpha Alpha Score, second on our board.
| Pillar | Score |
|---|---|
| Signal Quality | 19 / 20 |
| Transparency | 18 / 20 |
| Price-to-Value | 17 / 20 |
| Usability | 19 / 20 |
| Community Verdict | 19 / 20 |
| Total | 92 / 100 |
Signal Quality at 19/20 reflects what TrendSpider does better than almost anything else in this category: the automated trendlines, heatmaps, and scanner results are timely and accurate. The ML-drawn levels hold up against manual analysis. The backtesting output is real, equity curves, trade logs, drawdown metrics, not a simplified approximation. That's a high bar and TrendSpider clears it.
Usability at 19/20 is earned, not given. The first week carries a real learning curve, there's a lot here and the interface rewards exploration. But the platform is logically organized, the Sidekick AI reduces the friction of figuring out what you're looking at, and the no-code strategy builder is genuinely intuitive once you understand the condition logic. Time to first useful output is faster than most platforms at this complexity level.
Price-to-Value at 17/20 is the weakest pillar, and it's worth being direct about why. The Standard tier at $52.38/month is a capable charting tool, but it undersells the platform's actual capability. The features that justify the subscription, 1-minute backtesting, meaningful bar depth, trading bots, live at Enhanced ($107.31/month) and above. For a trader who needs those features, the value is real. For a trader who buys Standard expecting institutional-grade backtesting, the gap between expectation and reality is wide. That's a pricing structure issue, not a product quality issue, but it costs TrendSpider three points here.
Transparency at 18/20 reflects that TrendSpider is clear about what its AI does and doesn't do. The platform doesn't claim its ML predicts price. It claims it identifies levels and patterns from historical data. That's an honest representation.
Community Verdict at 19/20 matches the sentiment in independent trader communities. The Reddit discussion is substantively positive, with specific praise for the scanner and automated analysis tools. This is a platform that technical traders who've used it tend to recommend.
Sourced Stat Cards
Backtest interval by tier
Standard: 2-hour minimum. Premium: 1-hour minimum. Enhanced: 1-minute minimum. Advanced: 1-minute minimum.
Source: trendspider.com/pricing
Backtest depth by tier
Standard: 2,000 bars. Premium: 5,000 bars. Enhanced: 10,000 bars. Advanced: 30,000 bars.
Source: trendspider.com/pricing
Active alerts by tier
Standard: 10 alerts / 30-day expiry. Premium: 25 alerts / 60-day expiry. Enhanced: 50 alerts / 90-day expiry. Advanced: 100 alerts / 180-day expiry.
Source: trendspider.com/pricing
Tier pricing (annual billing)
Standard $52.38/mo. Premium $79.08/mo. Enhanced $107.31/mo. Advanced $154.08/mo.
Source: trendspider.com/pricing
Trading bot access
Available on Enhanced and Advanced tiers only.
Source: trendspider.com/pricing
Where TrendSpider Falls Short
Every tool that scores 92 out of 100 still has a 8-point gap. Here's where TrendSpider earns those deductions.
Entry-Tier Backtesting Is a Real Limitation
The Standard tier's 2-hour minimum interval and 2,000-bar depth cap are not minor inconveniences for intraday traders, they make the backtesting engine functionally useless for testing the strategies most day traders actually run. A 5-minute breakout strategy cannot be meaningfully tested at 2-hour resolution. Full stop.
The marketing doesn't always make this distinction clearly enough. Traders who buy Standard expecting to test their intraday setups will be disappointed. The fix is to buy Enhanced if backtesting is your primary reason for subscribing. But that's a $107/month commitment, and the gap between what Standard promises and what it delivers for this use case is wide enough to be a genuine drawback.
The Learning Curve in Week One Is Real
TrendSpider is a deep platform. The scanner, the strategy tester, the alert builder, the ML tools, the raindrop charts, the multi-timeframe analysis, there's a lot to configure and understand. Most traders coming from a basic charting tool will spend their first week just figuring out where things are.
This isn't a fatal flaw, the depth is part of the value, but it's worth naming honestly. The 14-day paid trial is not a free trial. You're paying to learn the platform during the period when you're least productive on it. Budget time for onboarding, not just money.
The Engine Will Happily Backtest an Overfit Strategy
This is the most important drawback for serious traders. TrendSpider's Strategy Tester will run any set of rules you give it and return results. It will not warn you if those results are the product of curve-fitting, if you've essentially designed a strategy that looks perfect on the specific historical period you tested because you kept adjusting the rules until it fit.
Overfitting is the silent killer of backtested strategies. A strategy with a 70% win rate over 200 trades in a specific 18-month window may have a 40% win rate in live trading if those 200 trades were the product of parameter optimization on that exact window. TrendSpider doesn't protect you from this. No backtesting engine does, it's a methodology problem, not a software problem. But traders who are new to backtesting need to know this going in.
The fix: test on one time period, validate on a separate out-of-sample period you didn't touch during development. If the results degrade significantly on the validation set, the strategy is overfit. For a deeper look at how to backtest without fooling yourself, aistockpickerapps.com/blog/how-to-backtest-a-trading-strategy-without-fooling-yourself covers the methodology in detail.
Final Verdict: Which Tier to Buy by Trader Type
TrendSpider is a serious platform that earns its 92/100 Alpha Score. The automated ML trendlines, scanner depth, and no-code backtesting engine are genuinely differentiated capabilities, not marketing claims dressed up as features.
But the tier you buy determines whether you get the platform that was described to you.
Buy Standard ($52.38/month) if you want automated charting, ML trendlines, support/resistance heatmaps, multi-timeframe analysis, and scanner access for swing trading on daily and weekly charts. Don't buy Standard if backtesting intraday strategies is your primary goal.
Buy Enhanced ($107.31/month) if you're a day trader or active swing trader who wants to actually test intraday strategies. This is the minimum viable tier for serious backtesting, 1-minute resolution, 10,000 bars, trading bots, 50 active alerts. This is where TrendSpider becomes the platform the marketing describes.
Buy Advanced ($154.08/month) if you run multiple strategies simultaneously, need 30,000 bars of depth for long-horizon testing, want 100 active alerts with 180-day expiry, and use the trading bot functionality at scale.
Skip TrendSpider entirely if you want a passive screener, you're not willing to spend time defining precise entry and exit rules, or you're a Pine Script developer who already has a workflow on TradingView. The platform rewards traders who want to build and test systems. If you want a list of stocks to watch, a simpler tool will do.
The AI functions and scanner are strong enough that even traders who never touch the Strategy Tester will find value here. But the backtesting engine is the differentiator, and using it properly, at the right tier, with well-defined rules, is what separates the traders who get real information from the ones paying for a feature they never actually run.
Systems over hacks. Test the process before you trade it.
One tool, scored five ways. There are 200+ more in the FullStack Alpha directory, filterable by category, price, and what they actually do.
Browse the directory → aistockpickerapps.com
Affiliate disclosure: FullStack Alpha may earn a commission if you purchase TrendSpider through links on this page. Scores and editorial content are independent of commercial relationships.
We test the tools. You get the verdict.
One email a week. What we tested, what scored, and what we'd skip. Written for traders, not for clicks.
Frequently asked
Topics in this teardown
Our verdict on TrendSpider
TrendSpider scores 92 on the strength of automation.