
TipRanks vs Seeking Alpha: Which Subscription Earns Its Fee?

Short version: pick TipRanks for a fast, track-record-backed verdict on a ticker, and pick Seeking Alpha Premium at $299 a year for written bull and bear cases plus quant grades.
Quick Answer
TipRanks vs Seeking Alpha comes down to one question: do you want a fast verdict or the argument behind it? TipRanks wins if you want to know which analysts have actually been right and you want a one-to-ten read on a ticker in under a minute. Seeking Alpha wins if you read research for 30 minutes before you buy and want written bull and bear cases plus quant grades. Premium pricing is $299 a year for Seeking Alpha Premium and roughly $359 a year for TipRanks Premium billed annually, which makes Seeking Alpha the cheaper of the two headline plans.
TipRanks vs Seeking Alpha: Key Takeaways
- Seeking Alpha Premium lists at $299/yr with a $4.95 first-month trial for new subscribers, and no ongoing standard monthly billing option after that.
- TipRanks Premium runs $29.95/mo billed annually (about $359/yr), dropping to $19.95/mo on the 3-year plan (about $239/yr equivalent) if you commit for 36 months.
- TipRanks Smart Score compresses 8 factors into a single 1-to-10 rating: analyst ratings, insider trades, hedge fund activity, blogger sentiment, technicals, and more.
- Seeking Alpha Factor Grades score 5 dimensions per stock: valuation, growth, profitability, momentum, and EPS revisions, plus a separate Quant Rating.
- Stock picks cost extra on Seeking Alpha. Alpha Picks is $499/yr standalone or $639/yr bundled with Premium. TipRanks includes its Top Stocks lists inside Premium.
- TipRanks Premium alerts cover up to 30 stocks by email. Seeking Alpha Premium includes a screener with 100+ filters and full earnings call transcripts.
- Both have real free tiers, and both hide the good stuff behind them. Test the interface for two weeks before you hand over a year of money.
How did we judge TipRanks vs Seeking Alpha?
We compared them on the only thing that matters to a position investor: does the subscription change what you buy, and can you point to the mechanism that changed it? Everything else is interface decoration.
Five criteria, applied to both:
- Core data you can't get free. Analyst success rates, insider transaction history, quant factor grades, transcripts. If a free tool already gives it away, it doesn't count toward the fee.
- The rating system's honesty. Does the tool show its factors, or does it say "proprietary" and stop talking? A score you can't decompose is a score you can't argue with, which means you can't learn from it.
- Time to first useful output. Week one decides whether you renew in month eleven. A platform that takes three weeks to configure has already lost.
- Price against the closest alternative. $299 a year is roughly $25 a month, or two Chipotle burritos and a coffee. That's not a lot for a real research edge. It's a lot for a prettier version of Yahoo Finance.
- What actual users say, across sources with different biases. Solicited reviews skew positive. Reddit skews negative. The gap between the two is usually the finding.
Our full methodology and pillar weights live on the how we test page. One note on both products: pricing changes constantly with promos, and renewal prices are what you actually pay in year two. Check the live page before you commit.
TipRanks vs Seeking Alpha: The Short Answer
Pick TipRanks if your bottleneck is trust. Pick Seeking Alpha if your bottleneck is reasoning.
That sounds abstract, so here's what it looks like at the desk.
You're looking at a mid-cap industrial name. Four analysts just raised price targets. You have no idea whether those four analysts have ever been right about anything. TipRanks answers that in about eight seconds by showing each analyst's success rate and average return on their past calls, alongside insider buying and hedge fund positioning on the same page. You get a Smart Score of 8, you note that the top-ranked analyst covering it has a 71% hit rate, and you move on with your day.
Different scenario. Same stock, and you're trying to understand why the margin story is supposed to work when the last two quarters said otherwise. A score of 8 tells you nothing here. Seeking Alpha gives you four contributors arguing about it in 2,000-word pieces, two of them bearish, plus the actual earnings call transcript so you can read what management said instead of what a headline said they said.
Same stock. Two completely different jobs.
The tough-love version: most investors buy the wrong one because they confuse speed with rigor. If you've never once read a full bear case on a stock you own, a faster consensus check won't fix your process. It'll just help you be wrong quicker.
TipRanks: Best for Analyst Track Records and Fast Consensus Checks
In the TipRanks vs Seeking Alpha matchup, TipRanks is the speed option: data first, prose almost never.
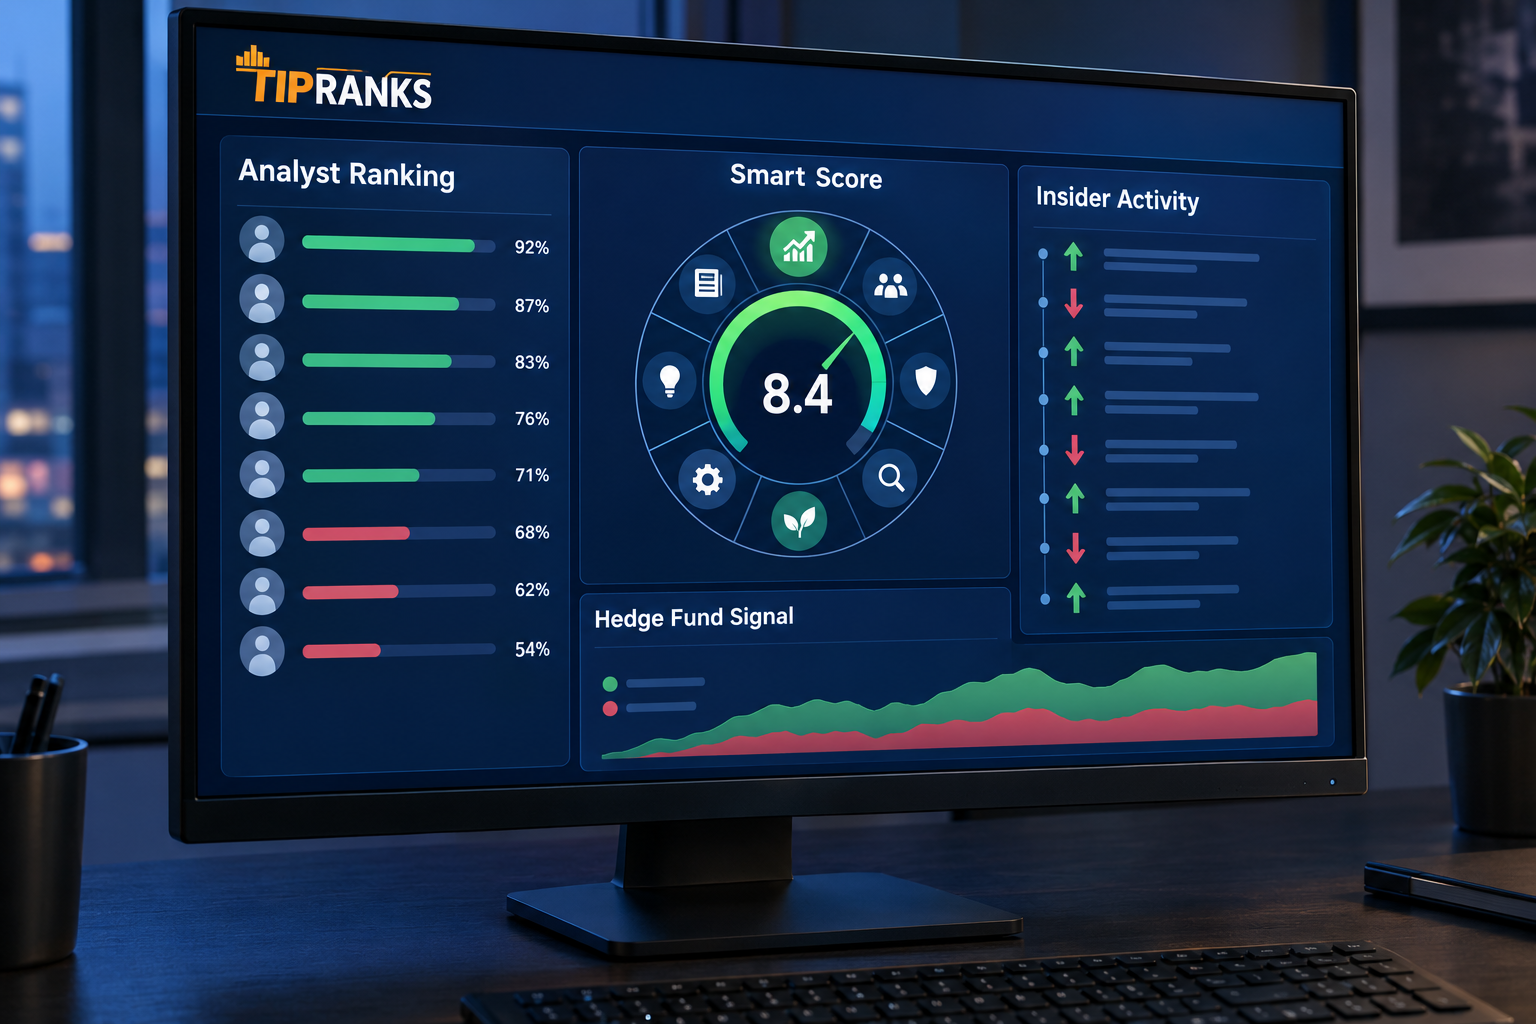
TipRanks is built around a question nobody on financial TV wants asked out loud: which of these experts has actually been right? It tracks Wall Street analysts, corporate insiders, hedge funds, and financial bloggers, then ranks each one by measured track record rather than by how confident they sound.
The Smart Score is the headline feature. It rolls 8 data factors into a single 1-to-10 rating, which includes analyst consensus, insider transactions, hedge fund activity, blogger sentiment, and technical indicators. You can see the factor breakdown, which matters more than the score itself. A stock at 8 driven by insider buying and hedge fund accumulation is a different animal from an 8 driven by momentum and blogger chatter.
What it does well
The analyst ranking system is the genuinely differentiated thing here. Price targets are everywhere and free. Price targets attached to a named analyst's measured hit rate and average return are not. That single feature changes how you read a downgrade.
Having insider trades and 13F hedge fund moves on the same stock page as the analyst panel also kills a real workflow problem. You stop opening four tabs. Fewer tabs, cleaner decisions.
Premium adds email alerts on up to 30 stocks, which is the right number for a position investor running a focused watchlist, and the full Top Stocks lists. The free Basic tier is genuinely usable as a trial, even though it hides most of the data you'd pay for.
Where it falls short
The Smart Score is a signal, not an argument. If you want to know why a stock scores 8, you get factor attribution, not analysis. There's no one explaining the competitive position or the debt maturity schedule. For a long-term position investor building a five-year thesis, that's a real gap, and no amount of dashboard polish fills it.
The Ultimate tier is the other problem. Regular pricing sits around $50/mo with promos as low as $25/mo, which works out near $600/yr if you keep it twelve months. That's about $240 more a year than Premium for features most buy-and-hold investors will open twice. If you're not a swing trader who needs the extra screening and portfolio tooling, Premium is the ceiling, not the floor.
Pros
- ✅ Ranks every analyst by success rate and average return, so you know whose price target to trust
- ✅ Smart Score condenses 8 data factors into one 1-to-10 rating with visible factor attribution
- ✅ Insider trades and hedge fund moves sit on the same stock page as analyst ratings
- ✅ Premium adds email alerts on up to 30 stocks plus the full Top Stocks lists
- ✅ Free Basic tier lets you test the interface before paying
- ✅ The 3-year plan cuts the effective cost to about $239/yr equivalent
Cons
- ❌ Smart Score is a quant signal, not written analysis, so investors who want reasoning behind a pick will find it thin
- ❌ The free tier hides most of the useful data
- ❌ Ultimate costs roughly $240 more a year than Premium for extras many long-term investors never use
- ❌ Premium at about $359/yr is more expensive than Seeking Alpha Premium at $299/yr
Best for
Self-directed retail investors who want data-driven stock ideas, expert rankings, and consolidated analyst and insider information to supplement research they're already doing themselves. Also strong for swing traders who need a fast pre-entry sanity check on the setup.
Not for you if you want somebody to explain the thesis. TipRanks tells you what the smart money is doing. It won't tell you why.
Seeking Alpha: Best for Deep Written Analysis and Quant Grades
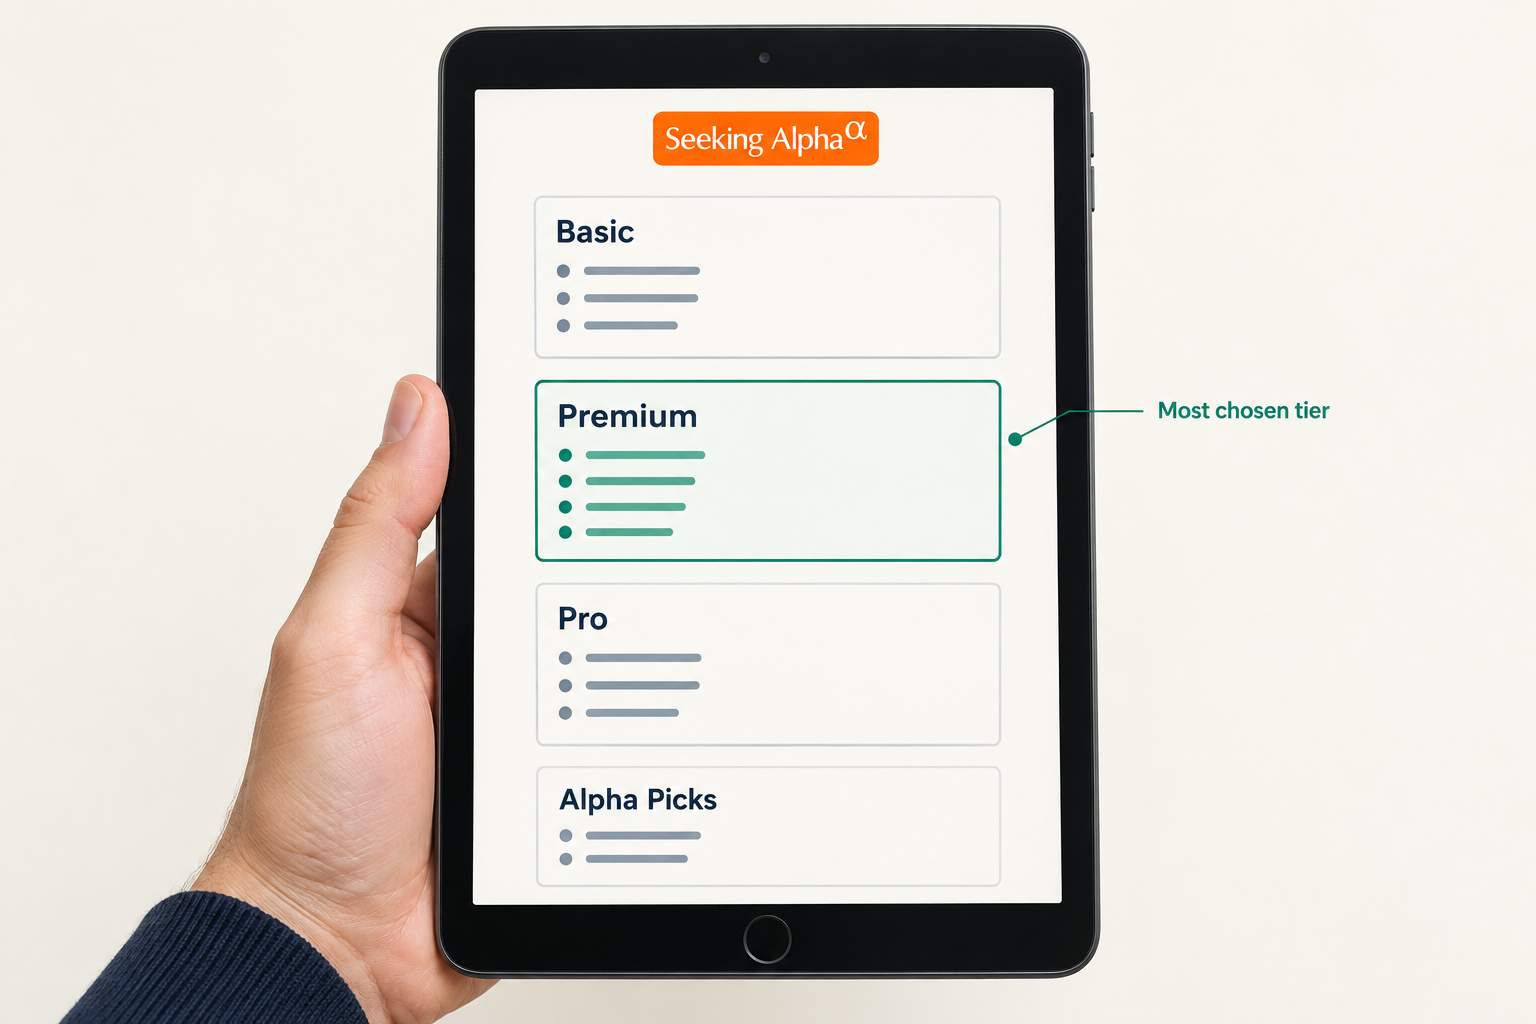
Seeking Alpha runs on crowd-sourced analysis at volume. Thousands of contributors publish long-form bull and bear cases on individual tickers, and Premium layers Quant Ratings and Factor Grades on top so you get a numerical read alongside the prose.
Factor Grades score five dimensions: valuation, growth, profitability, momentum, and EPS revisions. Each gets a letter grade relative to sector peers, which is the part people miss. A D+ on valuation for a software company means something different than a D+ for a utility, and the sector-relative framing does that work for you.
What it does well
The opposing-viewpoints structure is the feature. On a widely held name you'll frequently find a detailed bull case and a detailed bear case published within days of each other. Reading both is the closest thing retail has to an investment committee arguing in front of you. If you've ever bought a stock and only later discovered the obvious short thesis, this fixes that specific failure.
Premium also includes earnings call transcripts, Dividend Grades, and a screener with 100+ filters. For income-focused investors, the Dividend Grades alone (safety, growth, yield, consistency) do a job that otherwise takes a spreadsheet and an afternoon.
First-year promos are aggressive: $4.95 for the first month for new subscribers before it goes to $299/yr. Use the month. Read fifteen articles on stocks you already own and see whether anything changed your mind. If nothing did, don't renew.
Where it falls short
Contributor quality varies wildly, and that's structural, not fixable. An open platform with thousands of writers will produce brilliant sector specialists and people who reworded a press release. Premium doesn't filter that for you. You develop a mental list of five or six contributors worth reading, and until you do, you're paying to sort.
The other catch is the pricing architecture. Stock picks aren't included. Alpha Picks costs $499/yr standalone or $639/yr bundled with Premium for two model picks a month. Pro sits at $2,149/yr list after a $99 first month, which is institutional-adjacent money for a retail account. And there's no ongoing standard monthly billing option, so you're committing annually once the promo lapses. Promo prices renew at list. Budget for the list price, not the teaser.
Pros
- ✅ Deep bench of contributor articles, often with a bull case and a bear case on the same ticker
- ✅ Quant Ratings and Factor Grades score valuation, growth, profitability, momentum, and EPS revisions
- ✅ Premium screener with 100+ filters
- ✅ Earnings call transcripts and Dividend Grades included with Premium
- ✅ $4.95 first month for new subscribers makes the trial genuinely cheap
- ✅ Premium list price of $299/yr undercuts TipRanks Premium
Cons
- ❌ Contributor quality varies, so you still have to judge whose analysis is worth your time
- ❌ Alpha Picks costs extra on top of Premium ($499/yr standalone, $639/yr bundled)
- ❌ Promo prices renew at full list price, and there's no ongoing monthly option
- ❌ Pro at $2,149/yr is hard to justify for most retail portfolios
Best for
Fundamental and income-focused investors who read research regularly, want quantitative ratings and portfolio tools, and are comfortable paying annually for broad coverage plus curated ideas. Dividend investors get the most incremental value here.
Not for you if you don't read. Paying $299 for articles you won't open is the subscription equivalent of a gym membership in February.
TipRanks vs Seeking Alpha Comparison Table
Scan this table once and the TipRanks vs Seeking Alpha split is obvious: one sells scored data, the other sells written argument.
| Product | Core data | Rating system | Stock picks included | Free tier | Best for | Price |
|---|---|---|---|---|---|---|
| TipRanks | Analyst track records, insider trades, hedge fund 13F activity, blogger sentiment, technicals | Smart Score, 1-10, built from 8 factors | Yes, Top Stocks lists in Premium | Yes, Basic tier with limited data | Fast consensus checks and vetting whose price target to trust | Free; Premium $29.95/mo billed annually (about $359/yr); 3-yr plan $19.95/mo (about $239/yr equiv.); Ultimate about $50/mo list, promos from $25/mo (about $600/yr) |
| Seeking Alpha | Contributor articles (bull and bear), earnings call transcripts, quant factor data, dividend metrics | Quant Rating plus 5 Factor Grades, sector-relative letter grades | No, Alpha Picks sold separately | Yes, Basic tier with limited article access | Deep written analysis, dividend research, reading both sides before you buy | Free; Premium $4.95 first month then $299/yr; Alpha Picks $499/yr or $639/yr bundled; Pro $99 first month then $2,149/yr |
TipRanks vs Seeking Alpha pricing: which subscription gives you more for the money?
At list, the gap is about $60 a year in Seeking Alpha's favor, and that gap is the least interesting number in this section.
On raw price, Seeking Alpha Premium wins: $299/yr against roughly $359/yr for TipRanks Premium. On price per unit of something you can't get elsewhere, TipRanks wins, because nobody else scores individual analysts by measured accuracy.
Run the math on what you're replacing, not on the sticker.
Seeking Alpha at $299/yr replaces: a transcript service, a dividend screening spreadsheet, and the research reading you'd otherwise scrape together from free blogs of unknown quality. That's real substitution. If you currently read zero research, it replaces nothing and the value is zero.
TipRanks at $359/yr replaces: manually tracking which analysts have been right, pulling Form 4 insider filings from SEC EDGAR yourself, and cross-referencing 13F filings. All of that is technically free and publicly available. All of it also takes hours per name, and TipRanks has already done it. You're buying time, not information.
The 3-year TipRanks plan at about $239/yr equivalent flips the pricing comparison entirely. If you're confident you'll still be a position investor in 2029, that's the cheapest premium research subscription in the TipRanks vs Seeking Alpha matchup. If you change tools every eighteen months like most people, the annual plan is the honest choice.
Decision rule: if you spend more than two hours a week reading about stocks you own, Seeking Alpha returns more per dollar. If you spend less than one hour a week and mostly want a go/no-go signal before you buy, TipRanks returns more.
One more thing on value that nobody advertises. Neither subscription fixes position sizing. A better research input into a portfolio with no risk management is a better reason to be overexposed. If you can't state your maximum position size as a percentage of the account, fix that before you spend $299 on anything. Systems over hacks.
Top 5 features that matter most
Strip the TipRanks vs Seeking Alpha debate down to features that change buy decisions and you get five, split three to two in Seeking Alpha's favor.
Every platform has forty features. Five of them change buy decisions. Here they are, ranked by how much they should move your purchase.
1. Analyst accuracy scoring (TipRanks)
Price targets are free everywhere. A measured hit rate attached to the analyst issuing that target is rare, and it changes how you weight news. When a stock gets cut by an analyst with a 42% success rate, that's noise. When it gets cut by one with a 74% rate on that sector, that's information worth acting on.
2. Opposing-view coverage on the same ticker (Seeking Alpha)
The single most expensive mistake position investors make is building a thesis without ever reading the counter-argument. Confirmation bias is cheap. Reading a well-argued bear case on a stock you own is uncomfortable, which is exactly why it works.
3. Sector-relative factor grades (Seeking Alpha)
Valuation, growth, profitability, momentum, and EPS revisions, graded against sector peers. Absolute multiples mislead across industries. Relative grades don't, and they catch the "cheap for a reason" trap faster than a raw P/E scan.
4. Insider and institutional activity on one page (TipRanks)
Insiders sell for a hundred reasons and buy for one. Having Form 4 activity and 13F changes sitting next to the analyst panel means you see disagreement between Wall Street and management in the same glance.
5. Earnings call transcripts (Seeking Alpha)
Reading what a CFO actually said during Q&A, including the question they dodged, beats reading a summary of what they said. Earnings season gets easier when you can search the transcript instead of watching a replay.
Notice what's missing from this list: alerts, mobile apps, watchlist counts, and social features. Those are retention mechanics. They keep you subscribed. They don't make you a better allocator. If a sales page leads with notification volume, you're being sold engagement, not edge.
For a broader look at how scoring engines are built and where they break down, our guide to AI stock pickers covers the mechanics.
How do TipRanks and Seeking Alpha compare to their competitors?
Four rivals cover jobs neither platform does well, and one of them may fit you better than either.
Neither is the only option, and for several specific investor types, neither is the right one. Here's the honest field beyond TipRanks vs Seeking Alpha.
Motley Fool Stock Advisor ($199/yr list, frequently discounted for year one) is for the investor who wants to be told what to buy and hold for five years, full stop. Two picks a month, written up clearly, no screener, no analyst rankings. It's a recommendation service, not a research platform. It suits beginners who need conviction more than data, and it frustrates anyone who wants to check the work. We scored it 69/100, with transparency the weak pillar. Our Motley Fool Stock Advisor review explains why, and the Seeking Alpha vs Motley Fool comparison is the more direct head-to-head if picks are what you're shopping for.
Zacks Premium is the closest functional rival to TipRanks. It's built around earnings estimate revisions, the Zacks Rank (1 to 5), and style scores. If your process keys off analyst revision momentum, Zacks is more focused on that one factor than TipRanks is across eight. It suits investors who believe estimate revisions drive price, which is a defensible position with decades of academic support behind it.
Morningstar Investor is for the valuation-first, low-turnover investor. Analyst-written reports, fair value estimates, economic moat ratings, and best-in-class fund and ETF coverage. It's slower, more conservative, and better than both TipRanks and Seeking Alpha if a meaningful chunk of your portfolio sits in funds rather than individual names. Nobody covers ETFs like Morningstar.
Simply Wall St wins on comprehension. It turns a balance sheet into a visual snowflake chart and a plain-English narrative, and it covers international markets better than most US-centric tools. It's the best of this group for a beginner who finds financial statements intimidating, and the weakest for anyone who wants analyst-level depth. See our Simply Wall St review for the breakdown.
Where each of the five lands:
- Want to be handed picks? Motley Fool Stock Advisor.
- Trade on estimate revisions? Zacks Premium.
- Own funds and ETFs alongside stocks? Morningstar Investor.
- Can't read a 10-K yet? Simply Wall St.
- Want to vet the experts? TipRanks.
- Want to read the argument? Seeking Alpha.
If you'd rather compare data-first screening platforms instead of research subscriptions, Koyfin vs Stock Rover covers a different part of the field entirely.
The Alpha Score Breakdown: TipRanks vs Seeking Alpha
On the FullStack Alpha scale, TipRanks vs Seeking Alpha is a three-point race: TipRanks 78, Seeking Alpha 75.
TipRanks
TipRanks scores 78 out of 100 across five pillars, 20 points each.
| Pillar | Score |
|---|---|
| Signal Quality | 16 / 20 |
| Transparency | 17 / 20 |
| Price-to-Value | 14 / 20 |
| Usability | 16 / 20 |
| Community Verdict | 15 / 20 |
Seeking Alpha
Seeking Alpha scores 75 out of 100 across five pillars, 20 points each.
| Pillar | Score |
|---|---|
| Signal Quality | 15 / 20 |
| Transparency | 16 / 20 |
| Price-to-Value | 15 / 20 |
| Usability | 15 / 20 |
| Community Verdict | 14 / 20 |
Each score comes from FullStack Alpha desk research plus public user sentiment, and the pillar split is provisional. Full pillar detail sits in the TipRanks and Seeking Alpha reviews.
Buying guide: how to choose between them without wasting a year
Reviews can't settle TipRanks vs Seeking Alpha for you; your own watchlist and calendar can, in about two weeks.
Six checks. Do them in this order.
1. Count your reading hours honestly. Open your browser history and count how many hours you spent reading about individual stocks in the last month. Under four hours total? Buy TipRanks. Over eight? Buy Seeking Alpha. Between four and eight, buy the cheaper trial first.
2. Identify your actual bottleneck. Write down the last three stocks you bought and the reason you almost didn't. If the answer was "I wasn't sure whether to believe the analysts," that's TipRanks. If it was "I didn't understand the business well enough," that's Seeking Alpha.
3. Use both free tiers for two weeks. Both have real Basic plans. Run the same five tickers from your watchlist through each one and note which platform produced a sentence you hadn't thought of. That's your answer, and it cost nothing.
4. Take the cheap trial, not the annual plan. Seeking Alpha's $4.95 first month is the best-value trial in this category. Spend it. TipRanks doesn't advertise a comparable trial, so its free tier is the test.
5. Check the renewal price, then set a calendar reminder. Both platforms discount year one and renew at list. Put a reminder in your calendar 30 days before renewal with the actual list price written in the note. Most people don't, which is precisely why the promo model works.
6. Skip the top tiers unless you can name the feature. TipRanks Ultimate and Seeking Alpha Pro together run about $2,750 a year. If you cannot name the specific feature in the top tier you'll use weekly, you're buying a status upgrade.
The most common TipRanks vs Seeking Alpha mistake: buying both. Two subscriptions at $658 a year produce contradictory signals you then resolve by picking whichever one agrees with what you already wanted to do. That's not research, it's shopping for permission. One subscription you actually use beats two you skim.
Edge case worth naming: if you're primarily an ETF or fund investor with a handful of single names on the side, neither of these is your first purchase. Morningstar Investor is. Both TipRanks and Seeking Alpha are built around individual equities, and paying for single-stock depth when 80% of your portfolio is in index funds is spending money in the wrong place. Our AI ETF screeners guide covers the tools built for that job.
TipRanks vs Seeking Alpha FAQ
Is TipRanks or Seeking Alpha better for long-term investors?
Seeking Alpha, for most long-term position investors. Holding a stock for three to five years requires understanding the business, and that requires written analysis, transcripts, and factor grades rather than a 1-to-10 signal. TipRanks is better for the moment of entry, not the years after it.
Which one is cheaper, TipRanks or Seeking Alpha?
Seeking Alpha Premium at $299/yr is cheaper than TipRanks Premium at roughly $359/yr billed annually. TipRanks becomes cheaper only on its 3-year plan, which works out to about $239/yr equivalent at $19.95/mo billed every three years.
Do I need both TipRanks and Seeking Alpha?
No. They overlap on analyst consensus data and diverge on everything else, and two subscriptions running about $658 a year mostly generate conflicting signals you'll resolve with your existing bias. Pick the one that matches your bottleneck, use it for twelve months, then reassess.
Is the TipRanks Smart Score reliable enough to buy on?
Treat it as one input, not a trigger. The Smart Score aggregates 8 factors including analyst ratings, insider trades, and hedge fund activity, and its value is in the factor attribution rather than the headline number. Buying purely on a quant score with no thesis and no position sizing rule is how accounts get hurt.
Does Seeking Alpha Premium include stock picks?
No. Premium at $299/yr includes Quant Ratings, Factor Grades, the 100+ filter screener, transcripts, and full article access. Alpha Picks, which delivers two model picks a month, costs $499/yr standalone or $639/yr bundled with Premium.
Are the free tiers actually usable?
Both free tiers work as evaluation tools and not much more. TipRanks Basic shows the interface and limited data while hiding most analyst detail. Seeking Alpha Basic gives core market data with limited article access, so you'll hit the paywall on the pieces you most want to read. Use them for two weeks to judge the interface, then decide.
What happens to the price when my promo ends?
It renews at full list price with no partial credit. Seeking Alpha's $4.95 first month becomes $299/yr, its Pro $99 first month becomes $2,149/yr, and TipRanks promo pricing on Ultimate reverts toward roughly $50/mo. Neither Seeking Alpha plan offers an ongoing standard monthly option, so the renewal is an annual charge.
Which is better for dividend investors?
Seeking Alpha, clearly. Dividend Grades scoring safety, growth, yield, and consistency come with Premium, the contributor base skews heavily toward income strategies, and the screener filters on dividend metrics directly. TipRanks has dividend data but no equivalent grading framework.
What is the main difference in TipRanks vs Seeking Alpha?
TipRanks ranks the experts by measured track record and rolls 8 factors into a 1-to-10 Smart Score. Seeking Alpha sells written bull and bear cases plus sector-relative Factor Grades. One gives you a fast verdict, the other gives you the argument.
Which scores higher in TipRanks vs Seeking Alpha on the Alpha Score?
TipRanks scores 78 and Seeking Alpha 75 on the FullStack Alpha scale, based on desk research plus public user sentiment. The pillar split is provisional, and a three-point gap matters less than whether your bottleneck is trust or reasoning.
TipRanks vs Seeking Alpha for swing traders: which fits better?
TipRanks. The Smart Score, analyst rankings, and insider data on one page give a fast pre-entry sanity check. Seeking Alpha's long-form research pays off over holding periods measured in years.
Is TipRanks vs Seeking Alpha close on price?
At list, Seeking Alpha Premium costs $299 a year and TipRanks Premium roughly $359. TipRanks only gets cheaper on its 3-year plan, at about $239 a year equivalent.
Is there anything better than Seeking Alpha?
It depends on the job. TipRanks is better for vetting whose analyst calls have been right, Zacks Premium for estimate revisions, Morningstar Investor for funds and ETFs, and Simply Wall St for beginners. For bull and bear cases on the same ticker, nothing in this comparison beats Seeking Alpha.
Is TipRanks worth the money?
Yes, if your bottleneck is trust rather than information. Premium runs roughly $359 a year, or about $239 a year on the 3-year plan, and nothing else here scores individual analysts by measured track record. It earns a 78 Alpha Score, but if you want the reasoning behind a pick, Seeking Alpha fits better.
What is better than TipRanks?
For a different job, several tools are. Seeking Alpha is better for written analysis and dividend research, Zacks Premium for estimate revisions, and Morningstar Investor for valuation and fund coverage. For analyst accuracy scoring, TipRanks has no direct equal in this group.
TipRanks vs Seeking Alpha: Final Verdict
Our call splits by investor type, not by brand size, because the two products solve different problems.
Seeking Alpha Premium at $299/yr wins for the long-term position investor who reads. You get written bull and bear cases, five sector-relative Factor Grades, earnings transcripts, Dividend Grades, and a 100+ filter screener for less than TipRanks Premium costs. If you're building five-year theses on individual businesses, or you're income-focused, this is the subscription that changes buy decisions. Start with the $4.95 first month and read fifteen articles on stocks you already own before you commit to the year.
TipRanks Premium wins for the investor whose problem is trust, not information. If you're already doing your own fundamental work and what you need is a fast, honest read on whether the analysts and insiders agree with you, nothing else scores experts by measured track record the way TipRanks does. Use the free Basic tier first, then take the annual plan at $29.95/mo. Only take the 3-year plan at $19.95/mo if you're certain about your process.
Skip both if: you want to be handed picks (Motley Fool Stock Advisor), you trade estimate revisions (Zacks Premium), your portfolio is mostly funds (Morningstar Investor), or you're still learning to read a balance sheet (Simply Wall St).
Your next step, today: pull the five tickers on your watchlist, run them through both free tiers this week, and write down which platform produced one sentence you hadn't already thought of. That single exercise will settle this faster than any review, including this one. Then set the calendar reminder for renewal day. Cut the noise, keep the alpha.
Two tools compared here. 200+ catalogued in the FullStack Alpha directory, sorted by category, price and use case.
Compare the full field → aistockpickerapps.com
Some links in this article are affiliate links, which means we may earn a commission at no extra cost to you.
We test the tools. You get the verdict.
One email a week. What we tested, what scored, and what we'd skip. Written for traders, not for clicks.
More from FullStack Alpha