Seeking Alpha Top 10 Stocks 2026: The Picks, the Risks, the Math

Quick answer
The Seeking Alpha top 10 stocks 2026 list is an annual, paywalled selection built by Steven Cress, Seeking Alpha's Head of Quantitative Strategy, drawn from the platform's Quant Ratings. Treat it as a screened watchlist, not a buy list. The list tells you which names cleared a rules-based factor screen on a specific date. It does not tell you what's already priced in, how concentrated your portfolio becomes if you buy all ten, or what happens when the Revisions grade flips in April.
Seeking Alpha top 10 stocks 2026: key takeaways
Each point below comes from FullStack Alpha desk research on how the Seeking Alpha top 10 stocks 2026 list is built, not on any return it claims.
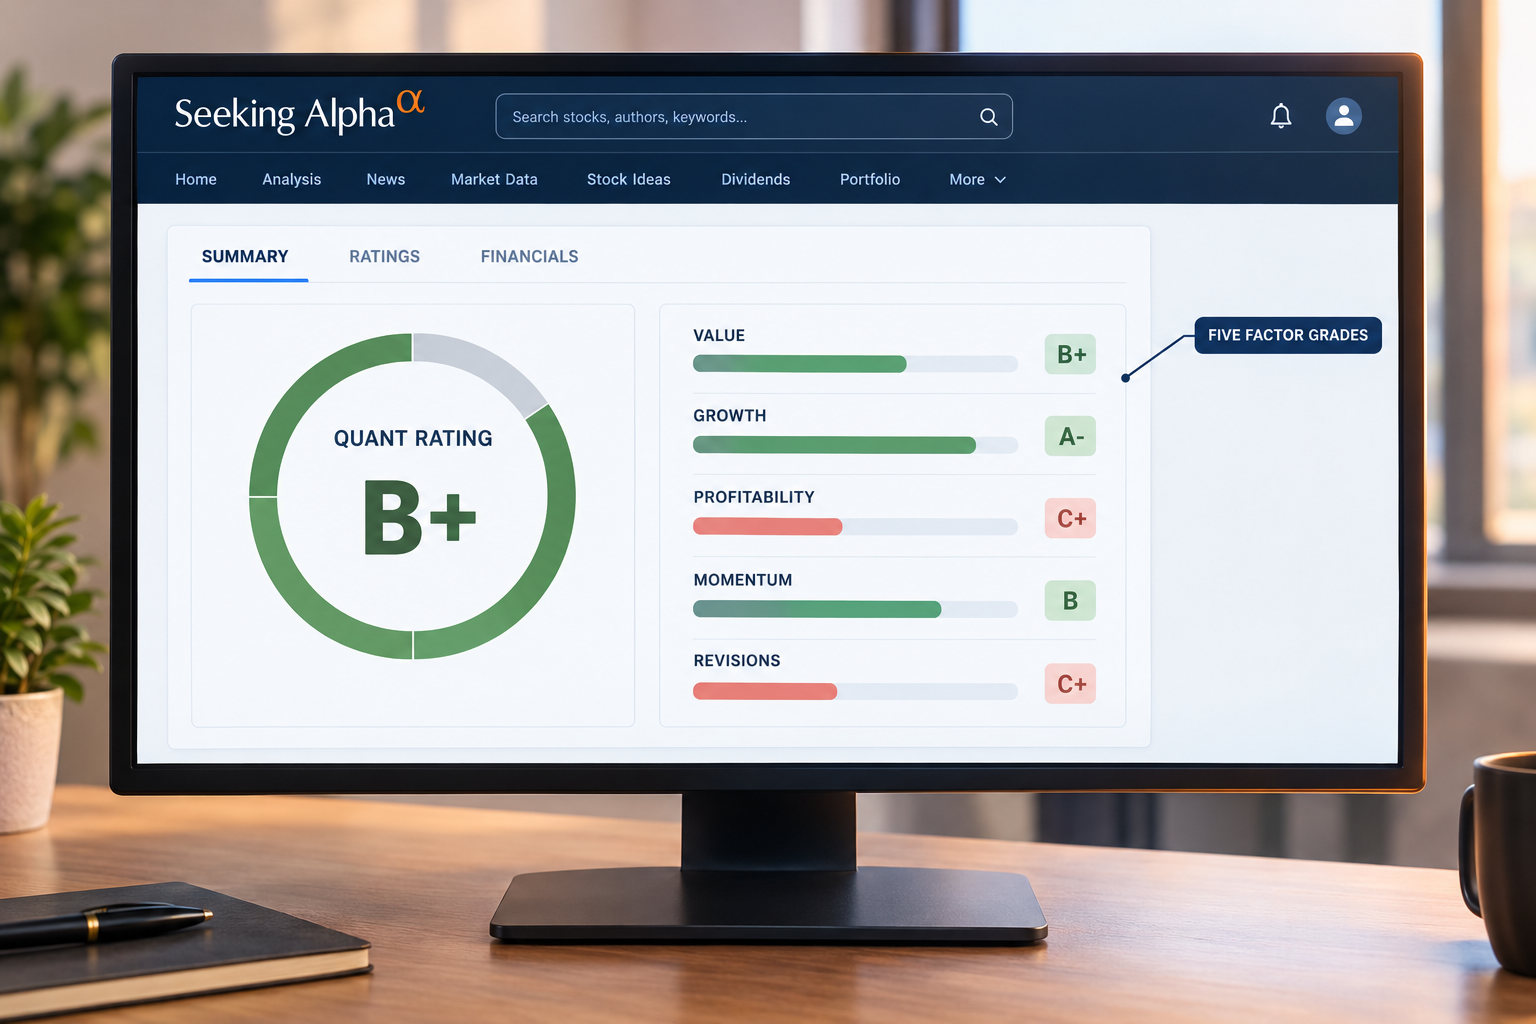
- The list comes from Seeking Alpha's Quant system, which grades every covered stock on five Factor Grades: Value, Growth, Profitability, Momentum, and EPS Revisions. Seeking Alpha states the model draws on over 100 metrics.
- Steven Cress publishes the annual list and mid-year reviews behind Seeking Alpha Premium. If a free blog claims to name all ten tickers, ask where they got it and whether the list has been rebalanced since.
- Buying all ten at equal weight means 10% per position. That's a concentrated portfolio, not a diversified one, and most readers underestimate what that does to drawdowns.
- A Quant Strong Buy paired with a D- Value grade is a momentum and revisions bet, not a cheap stock. Know which one you're actually making.
- Competitors do different jobs: Zacks Rank (1 to 5) is built mostly on earnings estimate revisions, Morningstar uses analyst fair value estimates and a 1 to 5 star scale, TipRanks Smart Score runs 1 to 10 on aggregated signals, and Motley Fool Stock Advisor publishes two human-analyst picks per month.
- The one number that matters more than any pick: your position size. Get that wrong and the best list in the world won't save you.
- Our full scoring of Seeking Alpha Premium lives in the Seeking Alpha review and the deep dive.
Quick comparison: where the Seeking Alpha top 10 stocks 2026 list sits
The Seeking Alpha top 10 stocks 2026 list is one product among several that promise better picks, and each one answers a different question.
| Service | Pricing model | Core method | Picks per year | Best for |
|---|---|---|---|---|
| Seeking Alpha Premium | Annual subscription, promo pricing runs often. Check the live page. | Rules-based Quant model, five Factor Grades, over 100 metrics | Annual Top 10 list plus daily Strong Buy screens | Self-directed investors who want factor data and both sides of the argument |
| Seeking Alpha Alpha Picks | Separate annual subscription, priced above Premium | Quant-derived, systematic selection | Two per month | Investors who want the model to decide, not to be argued with |
| Motley Fool Stock Advisor | Annual subscription, first-year discount then renewal at list | Human analysts, long-hold thesis | Two per month | Buy-and-hold investors who want narrative conviction |
| Zacks Premium | Annual subscription | Zacks Rank 1 to 5, earnings estimate revisions | Screens and lists, continuous | Investors trading around earnings season revisions |
| TipRanks Premium | Monthly or annual | Smart Score 1 to 10, aggregated analyst and insider data | Continuous rankings | Anyone who wants Wall Street consensus scored and ranked |
| Morningstar Investor | Annual subscription | Analyst fair value, moat rating, 1 to 5 stars | Continuous coverage | Valuation-first investors who want a price target with a rationale |
Prices move and promotional offers rotate constantly, so verify on each vendor's page rather than trusting a number in any article, including this one. We compare the two most-searched options head to head in Seeking Alpha vs Motley Fool.
What is the Seeking Alpha top 10 stocks 2026 list?
It's a once-a-year article, published on Seeking Alpha and gated behind Premium, in which Steven Cress screens the platform's Quant universe and surfaces ten names that scored strongest across the factor model at the time of writing. He follows it with performance updates, including a mid-year review.
Three things about the format that change how you should read it:
It's a snapshot, not a mandate. The Quant Ratings underneath the list update daily. A stock that made the January cut can lose its Strong Buy in March when analysts trim estimates. The article doesn't move. The rating does.
It's not a portfolio. There's no stated position size, no stop, no rebalancing rule, no cash allocation. Those are your job. A ten-name list handed to a reader with no sizing framework is a set of ingredients, not a meal.
It's sector-relative. Quant grades are assigned relative to a stock's sector. An A- Value grade in energy and an A- Value grade in software are not the same multiple. Miss that and you'll think you bought cheap when you bought "cheap for a semiconductor company."
The common mistake: readers screenshot the list, buy the four names they've heard of, skip the six they haven't, and end up with a portfolio that's neither the list nor a plan. If you're going to use a systematic list, use it systematically or don't use it.
How does the Seeking Alpha Quant system pick these stocks?
Every name on the Seeking Alpha top 10 stocks 2026 list starts as output from the same Quant engine.
The Quant model scores every covered US-listed stock against its sector peers on five Factor Grades, then blends those grades into a single rating from Strong Sell to Strong Buy. It's rules-based and updates daily, which means no analyst is talked into anything and no thesis gets defended past its expiration date.
Here's what each grade is actually measuring, in plain English:
- Value. Price against earnings, sales, book, cash flow, and enterprise value, versus the sector median. Low grade means expensive relative to peers.
- Growth. Historical and forward revenue, earnings, EBITDA, and cash flow growth rates.
- Profitability. Margins, return on equity, return on total capital, cash from operations. This is the grade that separates a real business from a story.
- Momentum. Relative price performance across multiple lookback windows versus the sector.
- EPS Revisions. How many analysts raised or cut estimates recently, and by how much. This is the grade that moves fastest and matters most for the next two quarters.
The engine underneath the annual list is the same engine anyone with a Premium account can run themselves. That's the honest read. The Top 10 article is curation plus commentary on top of a screen you have access to.
Decision rule: before you buy any name on the list, look at the grade spread. If Momentum and Revisions carry A grades while Value sits at D or F, you're buying a stock the market already likes at a price the market already respects. That can work. It also means the drawdown when revisions turn is faster and deeper, because there's no valuation floor under you. Size accordingly.
Edge case worth knowing: the Quant model is weakest on companies with short operating histories, negative earnings, or heavy one-off accounting. Recent IPOs and pre-profit biotech tend to produce noisy grades. If a pick falls into that bucket, the model is guessing with fewer inputs than usual.
The Seeking Alpha top 10 stocks 2026 picks by archetype: what each does, why it gets flagged, and the main risk
Here's where most articles about the Seeking Alpha top 10 stocks 2026 list fabricate. They list ten tickers, present them as the current 2026 selection, and never say whether those names still hold a Strong Buy or whether the writer ever saw the paywalled article.
We're not doing that. The full ten-name list sits behind Seeking Alpha Premium, and the Quant ratings that produced it change daily. Publishing a stale or secondhand list as if it were live would be the exact noise this site exists to cut.
What's more useful, and what you actually asked for: the underwriting work to run on whichever ten names you're looking at. The Quant model's construction means the list reliably clusters into a handful of archetypes, and each archetype fails in a predictable way. Learn the failure modes and you can vet the picks yourself in about twenty minutes each.
The AI infrastructure name
What it does: semiconductors, networking, power, or data center hardware feeding the AI capex cycle.
Why the model flags it: A grades on Growth, Profitability, Momentum, and Revisions. Estimates have been revised up for several quarters straight, which the model rewards heavily.
Main risk: capex concentration. A handful of hyperscalers fund most of the demand. When their spending guidance flattens, the revisions grade that got the stock onto the list turns into the thing that takes it off.
Valuation math to run: forward P/E against the company's own five-year range, not just the sector. Then check what revenue growth rate the current multiple implies. If the stock needs 30% growth for three more years to justify today's price, write that assumption down and ask whether one customer could break it.
The financial
What it does: insurer, broker, regional bank, or asset manager.
Why the model flags it: strong Value and Profitability grades. Financials screen cheap on book value and earnings almost structurally.
Main risk: the Value grade is often cheap for a reason. Credit quality, reserve adequacy, or interest rate sensitivity doesn't show up in a P/E ratio until it does.
Valuation math to run: price to tangible book versus return on tangible equity. A bank at 1.1x book earning 15% ROTE is a different animal from one at 1.1x book earning 7%. For insurers, check reserve development and the combined ratio trend.
The energy or commodity producer
What it does: oil and gas, refining, uranium, copper, or shipping.
Why the model flags it: A grade Value plus improving Revisions when the underlying commodity has run.
Main risk: you're buying a price forecast wearing a stock ticker. The Quant model doesn't forecast commodities. It just notices earnings went up.
Valuation math to run: normalize earnings across a full cycle, not the trailing twelve months. Then check the balance sheet: net debt to EBITDA above 2.5x in a cyclical is a position-sizing problem, not a footnote.
The healthcare or pharma name
What it does: large-cap pharma, medtech, or a diversified health services company.
Why the model flags it: Profitability and Revisions, usually off a drug launch or a guidance raise.
Main risk: patent cliffs and single-product concentration. Binary regulatory outcomes don't appear in any factor grade.
Valuation math to run: what percentage of revenue comes from the top two products, and when do they lose exclusivity? If the answer is "over 40%" and "within four years," the multiple should be lower than the sector, not higher.
The industrial, defense, or infrastructure name
What it does: aerospace suppliers, electrical equipment, engineering and construction.
Why the model flags it: backlog-driven Growth and Revisions, decent Profitability.
Main risk: backlog is a promise, not cash. Fixed-price contracts plus input cost inflation have wrecked plenty of industrials with record backlogs.
Valuation math to run: book-to-bill ratio and free cash flow conversion. If net income is growing and free cash flow isn't, working capital is eating the business.
The consumer name
What it does: retailer, restaurant chain, apparel, or travel.
Why the model flags it: Momentum and Value, often after a beaten-down sector rerates.
Main risk: consumer spending is the single most sentiment-sensitive input in the market, and same-store sales can roll over in one quarter.
Valuation math to run: EV/EBITDA versus the company's own history, plus the lease-adjusted debt figure. Retail balance sheets look better than they are until you add operating leases back in.
✅ Pros of using the list this way
- The factor data underneath every pick is visible, not a black box
- Seeking Alpha hosts bull and bear articles on the same ticker, so the counterargument is one click away
- Daily-updating ratings give you a defined exit signal (rating downgrade) rather than vibes
- Sector-relative grading stops you from comparing a utility to a software company
❌ Cons
- The list itself is a one-day snapshot published once a year
- Zero position sizing, stop loss, or portfolio construction guidance
- The Quant model is weakest exactly where retail gets most excited: pre-profit and newly public companies
- Contributor article quality varies wildly, and the platform doesn't rank contributors as clearly as it ranks stocks
Best for: long-term position investors who want factor evidence and are willing to do their own valuation work. Not for anyone who wants to be handed ten tickers and skip the reading.
Vetting table for the Seeking Alpha top 10 stocks 2026 picks
Run every name on the Seeking Alpha top 10 stocks 2026 list through the same five columns and the weak ones tend to reveal themselves.
Write the ticker in the left column as you work through whichever ten names you have in front of you. The rest is the checklist.
| Archetype (write the ticker in) | Sector | Factor Grades highlights to expect | Main risk | Valuation snapshot to pull |
|---|---|---|---|---|
| AI infrastructure | Information Technology | A Growth, A Revisions, D or F Value | Hyperscaler capex concentration | Forward P/E vs own 5-yr range, implied growth rate |
| Semiconductor cyclical | Information Technology | A Profitability, B Momentum, weak Value | Inventory cycle turning | Price to sales vs prior cycle trough and peak |
| Insurer or broker | Financials | A Value, A Profitability, B Revisions | Reserve adequacy, rate sensitivity | Price to tangible book vs return on tangible equity |
| Regional bank | Financials | A Value, C Growth | Credit quality, deposit costs | P/TBV, net interest margin trend, loan loss reserves |
| Oil and gas producer | Energy | A Value, B Revisions, C Growth | Commodity price assumption | Normalized EV/EBITDA, net debt to EBITDA |
| Large-cap pharma | Health Care | A Profitability, B Revisions | Patent cliff, product concentration | Forward P/E, top-2 product revenue share, exclusivity dates |
| Aerospace or defense supplier | Industrials | A Growth, B Profitability | Fixed-price contract risk | Book-to-bill, FCF conversion vs net income |
| Homebuilder or materials | Industrials / Discretionary | A Value, A Momentum | Rate sensitivity, order cancellations | Price to book, backlog trend, cancellation rate |
| Retailer or restaurant | Consumer Discretionary | B Value, A Momentum | Consumer spending rollover | Lease-adjusted EV/EBITDA, same-store sales trend |
| Software with rising estimates | Information Technology | A Revisions, A Growth, F Value | Multiple compression on any miss | Free cash flow yield, net revenue retention, rule-of-40 |
Fill this in before you buy anything. If you can't complete a row, you don't know the company well enough to size a position in it.
How should you read Seeking Alpha top 10 stocks 2026 performance claims?
Any Seeking Alpha top 10 stocks 2026 return figure you find is published by Seeking Alpha itself, and this site does not repeat it.
Seeking Alpha publishes its own performance updates on the list, including a mid-year review, and those numbers live behind the Premium paywall. We won't republish a return figure we can't independently verify, and neither should any other site. What we can tell you is how to read whatever number you do find.
Three questions that separate a real track record from marketing:
- Is it equal-weighted or cherry-picked? Ten names equal-weighted, measured from the publication date, against a stated benchmark. Anything else is a highlight reel.
- Against what benchmark? Beating the S&P 500 in a year when small-cap value ran 20% isn't skill if eight of the ten picks were small-cap value. Factor exposure explains more single-year results than stock selection does.
- How many years of samples? One year of ten stocks is roughly ten data points. You cannot distinguish skill from luck at that sample size. Anyone who tells you otherwise is selling something.
What a strong 2026 would actually prove: that the factor tilts baked into the Quant model happened to match the market regime this year. That's real, and it's worth something. It's not proof the same tilts work in 2027.
What a weak 2026 would prove: roughly the same thing in reverse. A rules-based model that underperforms for twelve months has not been invalidated. A rules-based model that underperforms for five years has.
This is the part investors get backwards constantly. They judge a system on one year of results and a coin flip on a lifetime of theory. We wrote more about that scoring problem in how accurate are AI stock pickers.
Top 5 Seeking Alpha Quant features investors should understand
Every tool behind the Seeking Alpha top 10 stocks 2026 list sits inside a Premium account.
These five features do more for a long-term investor than the annual list does.
1. Factor Grades on every ticker. Five letter grades, sector-relative, updated daily. The fastest way to check whether a stock you already own is cheap, growing, profitable, or just popular.
2. Rating change alerts. You can be notified when a stock moves from Strong Buy to Hold. That gives a systematic exit trigger, which is more than most subscription services provide. A list with no exit rule is half a strategy.
3. The Quant screener. Filter the whole universe by rating and individual factor grade. You can rebuild a version of the Top 10 yourself in a few minutes, using today's data instead of January's.
4. Bull vs bear article pairing. For most large caps, someone has written the long case and someone else has written the short case. Reading both is the cheapest risk management available.
5. Earnings revision data. The Revisions grade is the fastest-moving factor in the model and the one with the most academic support behind it. Watch it around earnings season. When revisions and price disagree, something is about to resolve.
Practical takeaway: set rating-change alerts on every position you own before you add a single new name. Knowing when to leave is worth more than knowing when to arrive.
How does the Seeking Alpha list compare to other stock-pick services?
Seeking Alpha gives you the most raw data and the least hand-holding. Motley Fool gives you the most conviction and the least methodology. Zacks gives you one factor done well. Morningstar gives you a price target with a written rationale. TipRanks gives you the crowd, scored.
Who each one actually suits:
Motley Fool Stock Advisor. Two picks a month, written by humans, built around long holds. Suits investors who need a story to hold through a 40% drawdown. The methodology is thin and the renewal price is the catch, which is why our Motley Fool Stock Advisor review lands where it does. If you want factor evidence, this isn't it.
Zacks Rank. A 1 to 5 rank driven primarily by earnings estimate revisions. Suits investors working a three-to-six-month horizon around earnings. It does one thing, and it's transparent about doing one thing. It won't tell you whether a stock is expensive.
TipRanks Top Analyst picks. Smart Score from 1 to 10, aggregating analyst ratings, insider activity, and other signals. Suits investors who want to know what Wall Street thinks, ranked by which analysts have been right. Consensus is a crowded trade by definition, so treat a 10 as information about positioning, not value.
Morningstar. Analyst-driven fair value estimates, economic moat ratings, and a 1 to 5 star scale based on price relative to fair value. Suits valuation-first, low-turnover investors, especially anyone building a dividend or core holdings sleeve. Slow-moving by design, which is a feature, not a bug.
Seeking Alpha Premium. Suits the self-directed investor who wants the factor data, the counterargument, and a daily-updating rating, and who will do the valuation work. If you want to be told what to buy without reading, buy an index fund and save the subscription.
Choose by horizon: under six months, Zacks. Three to five years on valuation, Morningstar. Three to five years on factors with your own analysis on top, Seeking Alpha. Need narrative conviction to hold, Motley Fool. More head-to-heads in our comparison hub.
The Alpha Score Breakdown
The score rates the Quant system behind the Seeking Alpha top 10 stocks 2026 list, not the stocks on it.
Seeking Alpha Premium scores 75 out of 100 across five pillars, 20 points each.
| Pillar | Score | What drives it |
|---|---|---|
| Signal Quality | 15 / 20 | Quant ratings update daily and the Factor Grades match the underlying data. The annual list is a stale snapshot by design |
| Transparency | 16 / 20 | The five factors and their inputs are published, which puts it well ahead of "proprietary AI" black boxes. Exact factor weightings are not fully disclosed |
| Price-to-Value | 15 / 20 | Annual pricing against a free tier that gives away real data, and against Alpha Picks upselling at a higher price |
| Usability | 15 / 20 | Grades are readable in seconds. The screener and article firehose take longer to tame |
| Community Verdict | 14 / 20 | Reddit threads on Quant ratings, Trustpilot billing complaints, and app store mobile feedback each tell a different story. The gap is the finding |
The score comes from FullStack Alpha desk research plus public user sentiment, and the pillar split is provisional. The full breakdown lives in the Seeking Alpha deep dive. How we score →
Comparing Seeking Alpha with other research tools? Browse the FullStack Alpha directory and filter 200+ tools by category, price and what they actually do.
Seeking Alpha top 10 stocks 2026 FAQ
Straight answers to what investors ask most about the Seeking Alpha top 10 stocks 2026 list.
Where can I see the full Seeking Alpha top 10 stocks 2026 list?
Behind Seeking Alpha Premium. Steven Cress publishes the article and the follow-up performance reviews to subscribers. Free summaries floating around the web are usually secondhand and may predate rating changes.
Is the Seeking Alpha Quant rating the same as the analyst rating?
No. Seeking Alpha shows three separate ratings on most tickers: the Quant rating (rules-based model), the Seeking Alpha analyst rating (contributor consensus), and the Wall Street rating (sell-side consensus). They frequently disagree, and the disagreement is the useful part.
Should I buy all ten picks?
Only if a ten-stock, 10%-per-name portfolio matches your risk tolerance and you have no other equity exposure creating overlap. Most long-term investors are better off using the list as a research queue and sizing 2% to 5% per name alongside a core index position.
How often do Quant ratings change?
Daily. A stock can lose its Strong Buy within weeks of appearing on an annual list, usually because EPS Revisions turned negative. Set rating-change alerts rather than checking the January article.
Does the Quant model account for valuation?
Yes, through the Value grade, but sector-relative. A software company can hold an A- Value grade at a multiple that would be expensive in consumer staples. Always pull the absolute multiple yourself.
Is Seeking Alpha Premium or Alpha Picks better for a long-term investor?
Premium if you want to analyze and decide. Alpha Picks if you want a systematic two-picks-a-month feed and won't second-guess it. Premium teaches you more; Alpha Picks asks less of you and costs more.
What's the biggest mistake people make with lists like this?
Buying the names they recognize and ignoring the rest, then judging the list on that partial basket. Either run the system or don't. Half a system with full conviction is how accounts get hurt.
Can I replicate the list with free tools?
Partly. Free screeners at Finviz and similar tools cover fundamentals and momentum, but they don't reproduce Seeking Alpha's sector-relative grading or its revisions data. Our free AI stock tools guide covers what you can get without paying.
When is the Seeking Alpha top 10 stocks 2026 list published?
Once a year, as a Premium article by Steven Cress, followed by performance updates that include a mid-year review. The Quant Ratings underneath it update daily, so the list starts aging the day it goes live.
Is the Seeking Alpha top 10 stocks 2026 list free?
No. The full list sits behind Seeking Alpha Premium, which lists at $299 a year. Free summaries elsewhere are usually secondhand and may predate rating changes.
How is the Seeking Alpha top 10 stocks 2026 list different from Alpha Picks?
The top 10 is an annual Premium article built from Quant Ratings. Alpha Picks is a separate $499 a year service that delivers two picks a month.
What are Zacks top 10 stocks for 2026?
Any Zacks list lives behind the Zacks paywall, not on Seeking Alpha. Zacks ranks stocks 1 to 5 based mostly on earnings estimate revisions, so its favorites tilt toward names with rising estimates. Run them through the same vetting table before you size anything.
What are the top 10 stocks to purchase in 2026?
Nobody can know which stocks will lead a given year. A screened list like Seeking Alpha's shows which names cleared a factor model on one date, so check the current Quant Rating, the grade spread and the valuation math before you buy.
What are the 10 most undervalued stocks right now?
No list can answer that for long, because prices and estimates move daily. Screen on the Seeking Alpha Value grade, keep in mind it is sector-relative, then pull the absolute multiple yourself or compare against Morningstar fair value estimates.
Which stock will boom in 2026?
Nobody can know, and a confident answer is a red flag. Use tools like Seeking Alpha's Quant Ratings to build a watchlist, set rating-change alerts, and size each position so one wrong call cannot wreck the account.
Final verdict on the Seeking Alpha top 10 stocks 2026 list
Use the Seeking Alpha top 10 stocks 2026 list as a screening output, then do the part the list skips. The value isn't in the ten tickers. It's in the Factor Grades, the daily rating updates, and the bear case sitting one tab away from the bull case. The annual article is marketing for a genuinely useful data product.
Your next step, and it takes an hour: open the vetting table above, pick the three names on your list you understand best, and fill in every column. Forward multiple, the main structural risk, and the one assumption the price depends on. If you can't complete a row, the name goes on the watchlist, not in the portfolio. Then set a rating-change alert on anything you do buy, and write your position size down before you click. Discipline beats prediction, every single year.
One tool, scored five ways. There are 200+ more in the FullStack Alpha directory, filterable by category, price and what they actually do.
Browse the directory → aistockpickerapps.com
Some links in this article are affiliate links, and we may earn a commission at no extra cost to you. Full disclosure.
We test the tools. You get the verdict.
One email a week. What we tested, what scored, and what we'd skip. Written for traders, not for clicks.
More from FullStack Alpha