

The Seeking Alpha Renewal Price Nobody Quotes
Short on time? The Seeking Alpha Alpha Score scorecard breaks the 75/100 down by pillar, with pricing and the verdict, in about 90 seconds.
See the score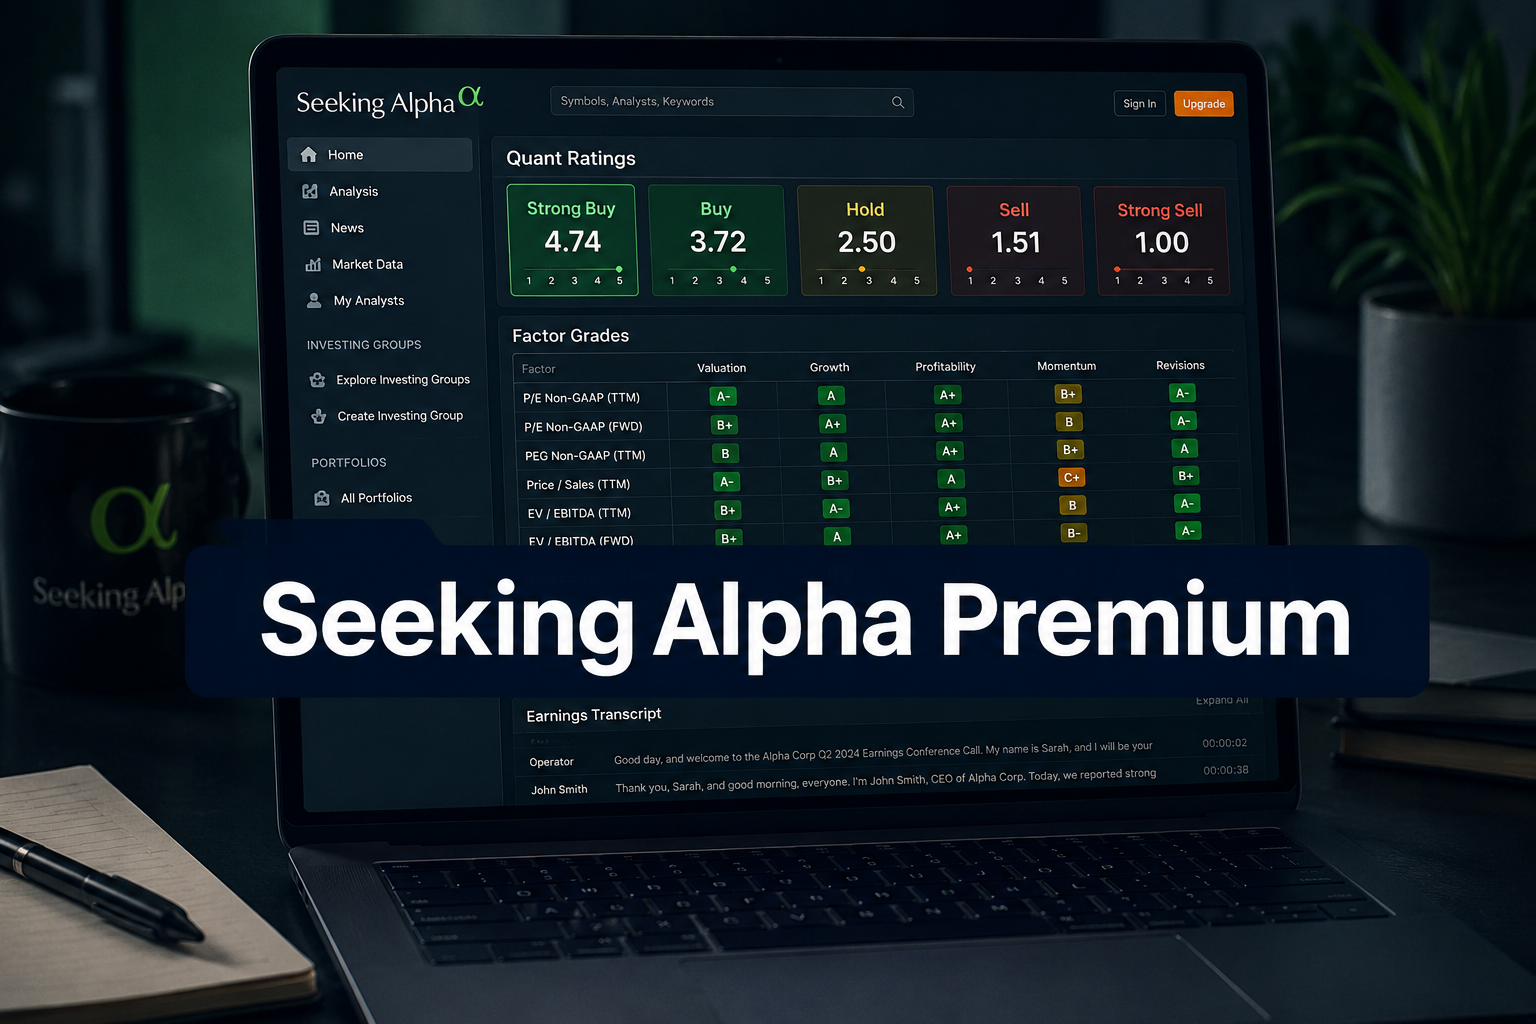
Is Seeking Alpha worth it for fundamentals-driven, long-term investors? Yes, Premium is a genuine research upgrade for anyone doing their own stock analysis, but only if you go in knowing the real annual cost is $299, not $4.95.
Key Takeaways
- Seeking Alpha Premium opens at $4.95 for the first month, then renews at $299 per year, that gap is the number most buyers miss
- Alpha Picks costs $449 in year one and steps up to $499 on renewal, a curated stock shortlist, not a research platform
- Seeking Alpha Pro runs $2,400 per year after a $99 introductory month, priced for professionals, not retail investors
- A 7-day free trial is available on Premium; use it to stress-test the Quant Ratings and Factor Grades before committing
- Quant Ratings score every US-listed stock on a consistent, algorithm-driven system across five Factor Grades: Value, Growth, Profitability, Momentum, and Revisions
- FullStack Alpha Score: 75/100, solid research depth and usability, with Price-to-Value (13/20) as the weakest pillar due to the introductory-to-renewal step-up
Is Seeking Alpha Worth It for Long-Term Investors?
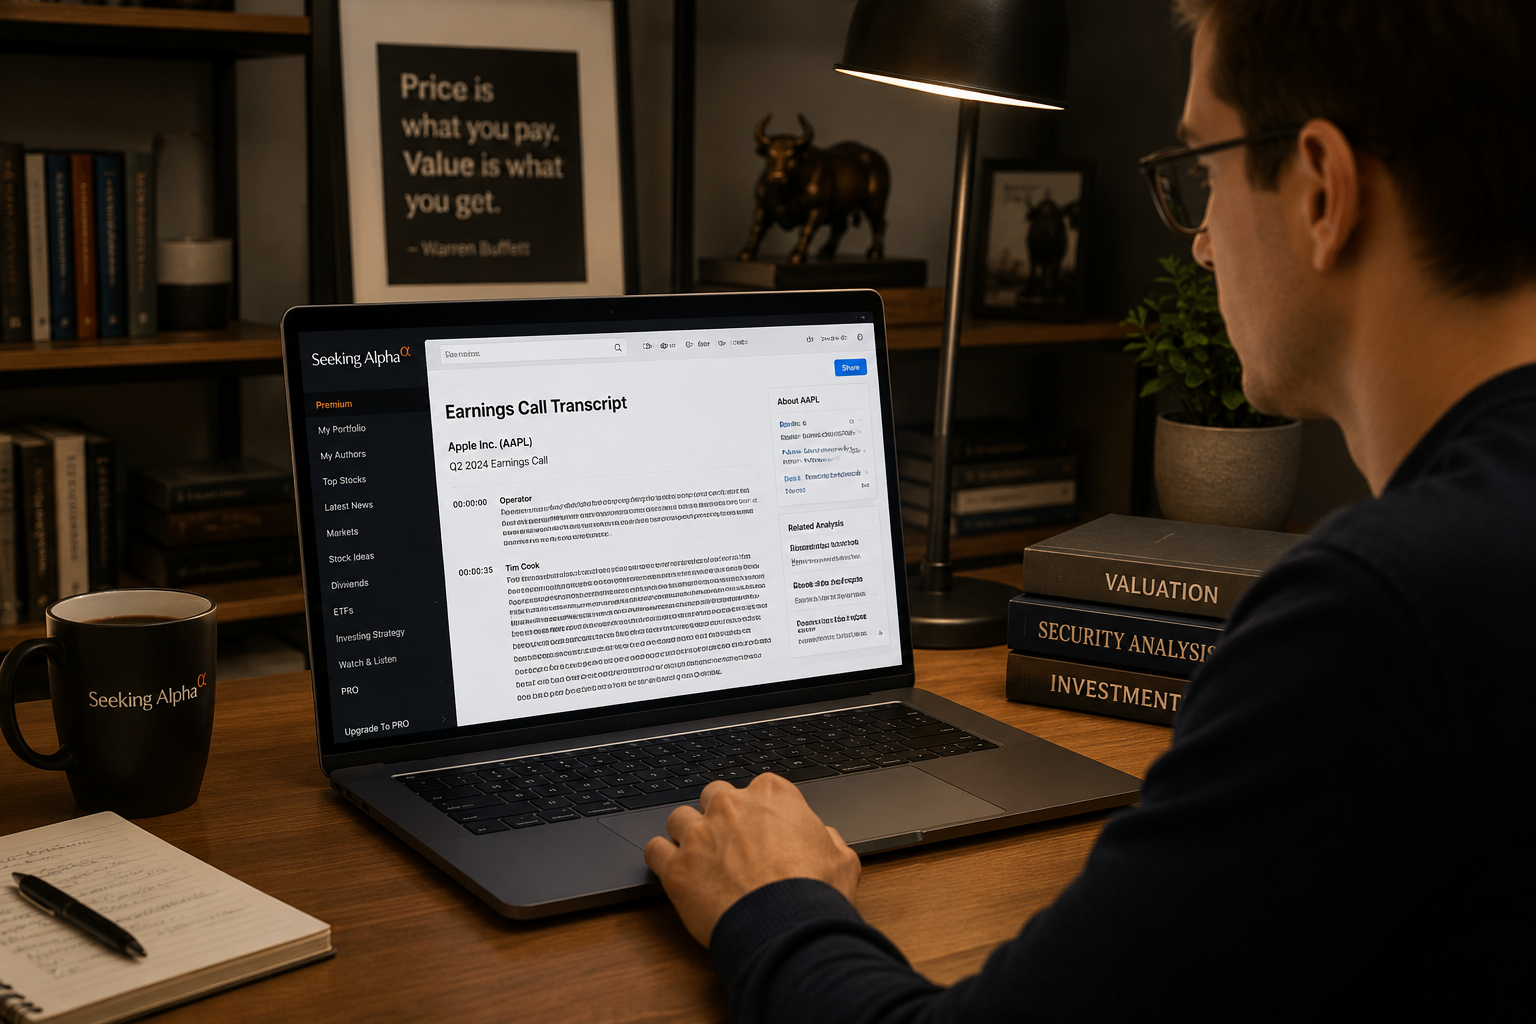
For a fundamentals-driven investor who reads before they buy, Seeking Alpha Premium is worth the $299 annual renewal. The platform consolidates what would otherwise require three separate subscriptions: a data terminal for financials, a transcript service for earnings calls, and a second-opinion layer for bull and bear cases on any ticker. That's a real replacement, not a marketing claim.
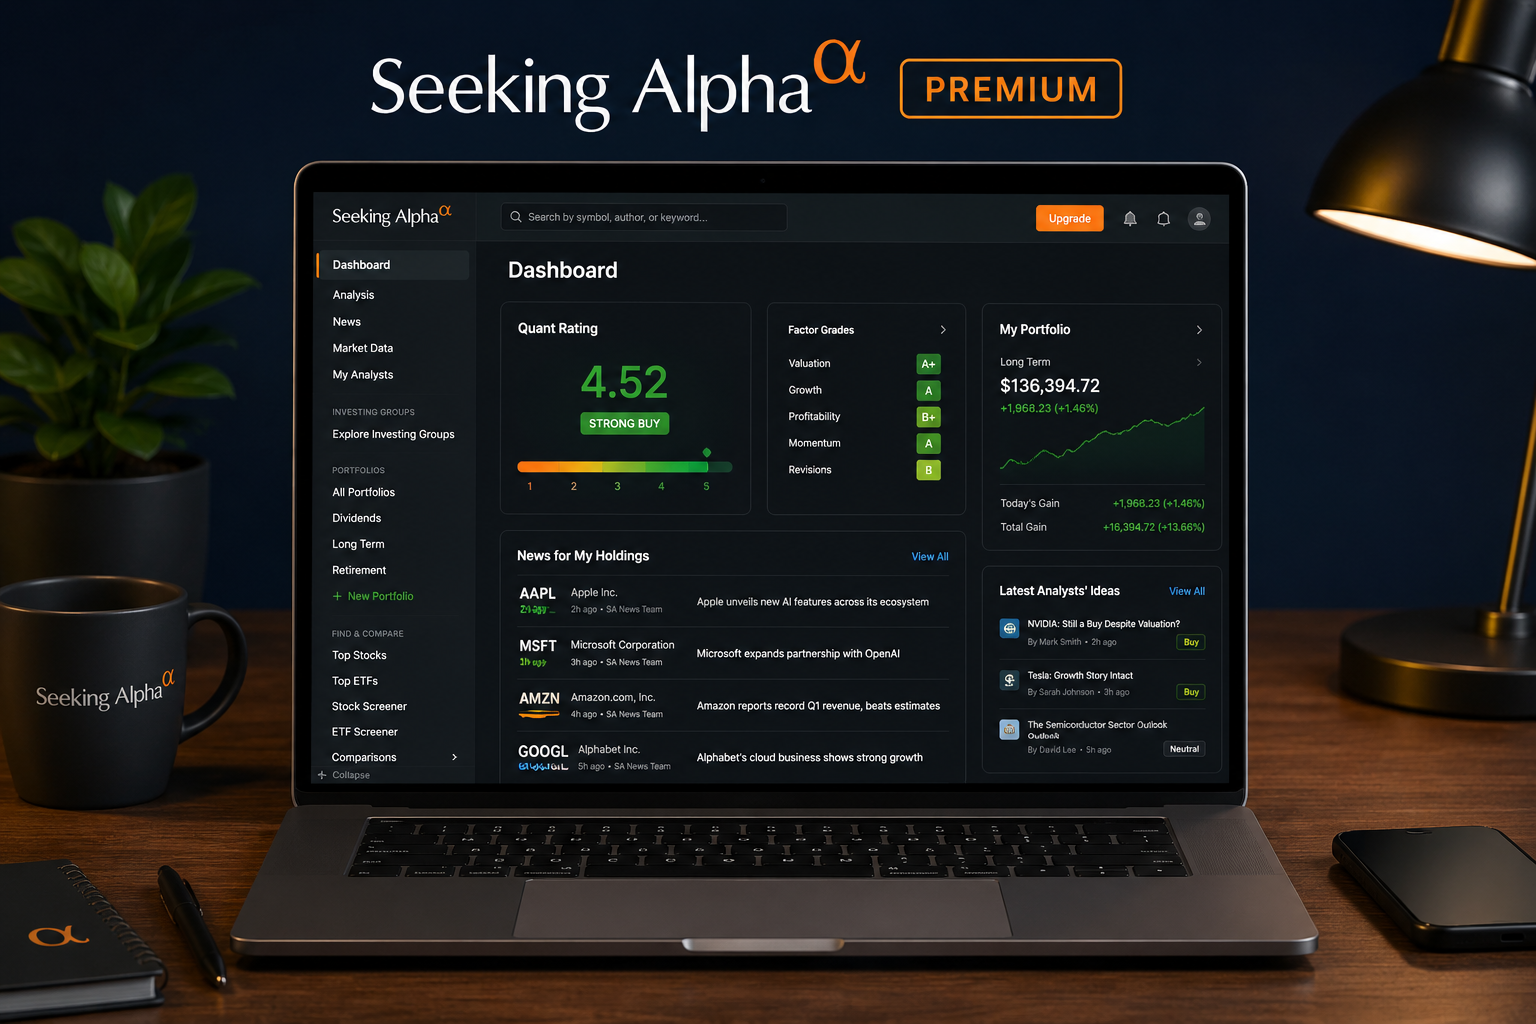
The reader this is built for holds positions for months or years, cares more about a company's free cash flow trend than its five-minute price action, and already uses the free Seeking Alpha tier for headlines. Premium unlocks the analytical infrastructure underneath those headlines, the scoring system, the historical data, and the contributor research that turns a headline into an actual thesis.
What Premium replaces in practice:
- A data terminal: ten years of financial statements, comparable to what you'd pull from a Bloomberg terminal at a fraction of the cost
- A transcript service: full earnings call transcripts, available within hours of the call, without a separate subscription to a service like Motley Fool or S&P Global
- A second opinion: contributor analysis from tens of thousands of writers, giving you a bull and bear case on almost any ticker within hours of a catalyst
The platform is not for everyone. It doesn't replace a broker's execution tools, it doesn't generate trade alerts, and it won't tell you when to buy or sell. What it does is give you better raw material to make that decision yourself. For the investor who wants to do that work, it earns its price.
What Do Quant Ratings and Factor Grades Actually Measure?
Quant Ratings are the strongest reason to pay for Seeking Alpha Premium, and they're worth understanding precisely before you rely on them.
The short version: a Quant Rating is a score, not a forecast. It tells you where a stock stands relative to its sector peers across five measurable dimensions right now. It does not predict what the stock will do next week or next year.
How Quant Ratings work
Seeking Alpha's Quant Rating system scores every US-listed stock on an algorithm-driven model that processes thousands of data points without any human analyst input. The score runs from 1.0 (Strong Sell) to 5.0 (Strong Buy) and is recalculated daily. Because no human touches the model between data inputs and output, the system doesn't have the career-risk bias that shapes most Wall Street ratings, an analyst at a major bank rarely issues a Strong Sell on a company their firm does business with. The quant model doesn't care.
The rating is a relative score within a sector. A stock rated 4.8 in Consumer Staples is being compared to other Consumer Staples names, not to the entire market. That matters for how you use it. A Strong Buy in a weak sector is a different signal than a Strong Buy in a sector with strong fundamentals.
The five Factor Grades
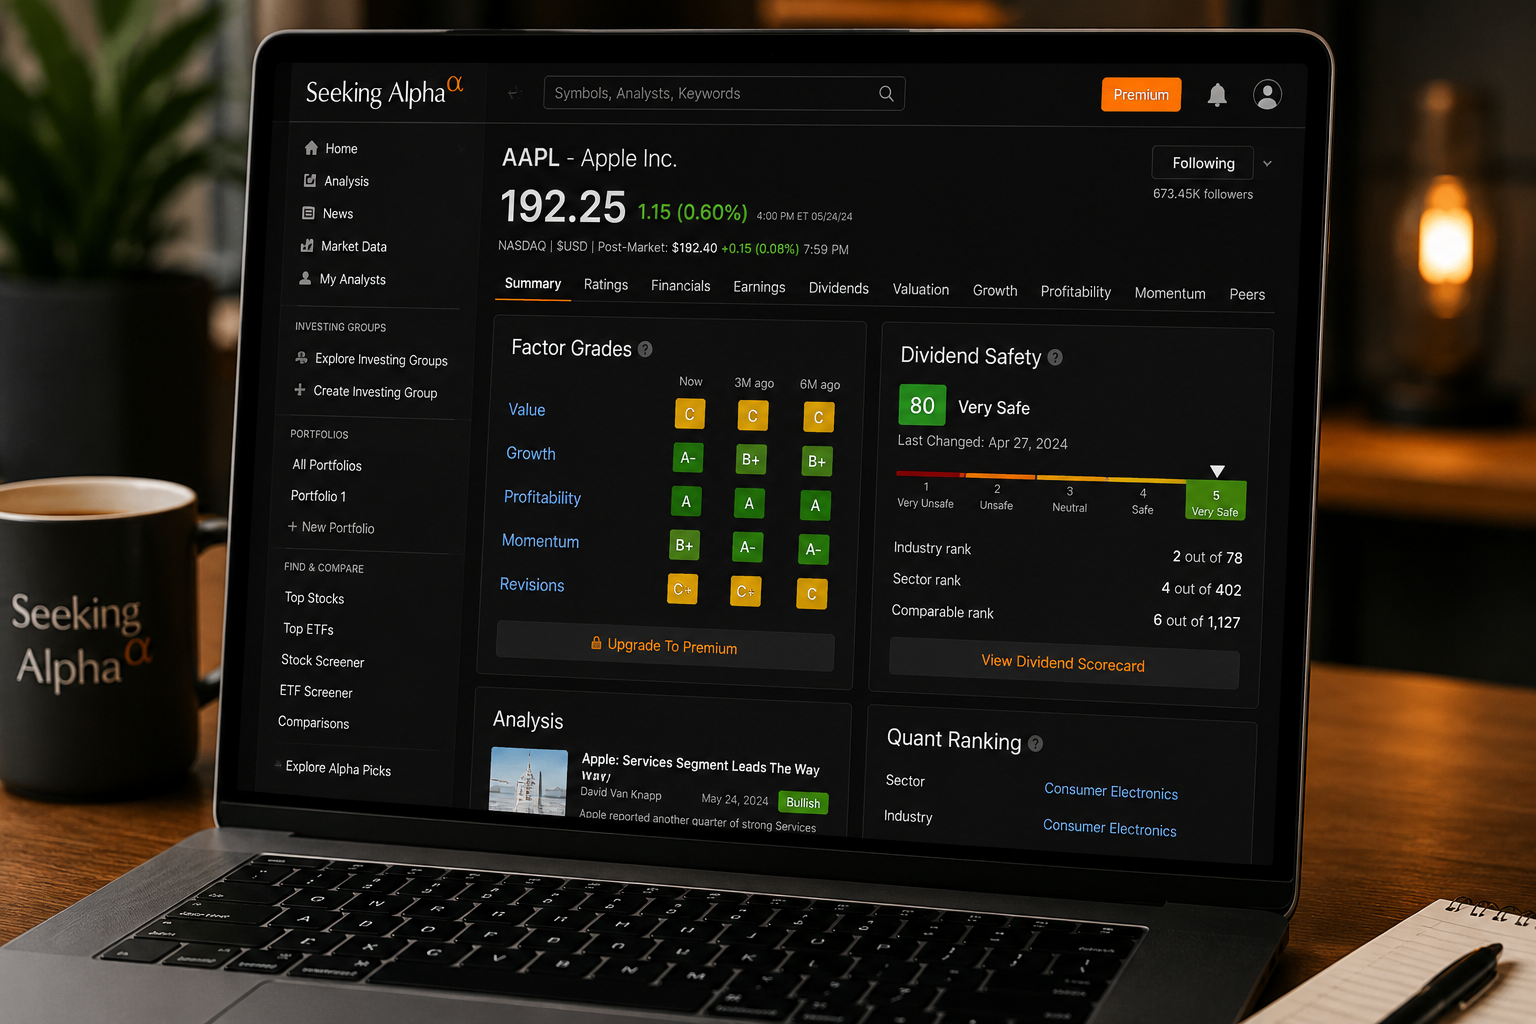
Factor Grades break the Quant Rating into its components, each scored A+ through F:
Value, How cheap or expensive the stock is relative to peers, measured across price-to-earnings, price-to-book, price-to-sales, price-to-cash-flow, and EV/EBITDA ratios. A value investor looking for a margin of safety starts here. An A in Value doesn't mean the stock is cheap in absolute terms; it means it's cheap relative to its sector. That distinction matters.
Growth, Revenue growth, earnings growth, EBITDA growth, and free cash flow growth, measured both on a trailing and forward basis. This grade tells you whether the business is expanding or contracting, and how that compares to sector peers. A dividend investor who wants a company growing its payout capacity watches this grade closely.
Profitability, Gross margin, operating margin, net margin, return on equity, return on assets. This is the quality filter. A company can have strong growth and a terrible Profitability grade if it's burning cash to buy revenue. For long-term holders, Profitability is often the most durable signal in the set.
Momentum, Price performance over one month, three months, six months, and twelve months, relative to peers. This is the one grade that's explicitly backward-looking on price rather than fundamentals. A value investor might deliberately look for a stock with strong Value and Profitability grades but weak Momentum, the setup where a fundamentally sound business has been beaten down in price.
Revisions, How analysts are changing their earnings estimates. Upward revisions tend to precede positive earnings surprises; downward revisions tend to precede misses. This grade is a sentiment proxy, it tells you which direction the professional analyst community is leaning, even if you don't trust their absolute numbers.
Why a consistent scoring system beats scattered opinion
The argument for using Factor Grades rather than reading five different analyst reports is consistency. Every stock gets graded on the same methodology, at the same time, against the same peer group. When you read five analyst reports, you're reading five different methodologies, five different time horizons, and five different definitions of "cheap." The Factor Grades give you a common language across your entire watchlist.
For a long-term holder building a diversified portfolio, that consistency is operationally useful. You can screen for stocks with A grades in both Profitability and Value, then read the contributor analysis to understand why those grades exist. The quant system surfaces the candidates; the fundamental research confirms or kills the thesis.
One honest caveat: the quant methodology is not fully published. Seeking Alpha describes the factors and the general approach, but the exact weighting and calculation logic is proprietary. That's why Transparency scored 14 out of 20 in the Alpha Score breakdown. You can use the grades confidently as a screening and comparison tool. You should not treat them as a black-box oracle.
Which Seeking Alpha Features Earn the Subscription?
Premium unlocks a specific set of tools. Here's what actually gets used and why each one earns its keep.
Full earnings call transcripts
Every earnings call, searchable and available within hours of the live event. This alone replaces a separate transcript subscription. For a long-term investor, reading the transcript rather than a summary matters, management tone, the questions analysts ask, and the answers executives dodge are all in the full text. Summaries strip that signal out.
Ten years of financial statements
A decade of income statements, balance sheets, and cash flow statements in a consistent format, with the ability to chart any line item over time. Seeing free cash flow margin trend over ten years tells you something a single-year snapshot can't. This is the data terminal replacement.
Dividend safety scoring
For income investors, the Dividend Safety Score is one of the more practically useful features on the platform. It grades dividend sustainability on a letter scale, drawing on payout ratio, free cash flow coverage, balance sheet strength, and earnings stability. It's not infallible, no model catches every cut before it happens, but it's a faster first filter than building the analysis from scratch.
The portfolio tracker
Add your holdings and the platform surfaces news, earnings dates, analyst rating changes, and contributor articles specifically for those tickers. For someone holding 15 to 20 positions, this replaces a manual news scan. The signal-to-noise ratio is better than a generic financial news feed because it's filtered to what you actually own.
Catalyst Watch
Upcoming earnings dates, dividend ex-dates, analyst days, and other scheduled events for any ticker. For a long-term holder who doesn't trade around events but wants to know when volatility is likely, this is a useful calendar.
Screeners
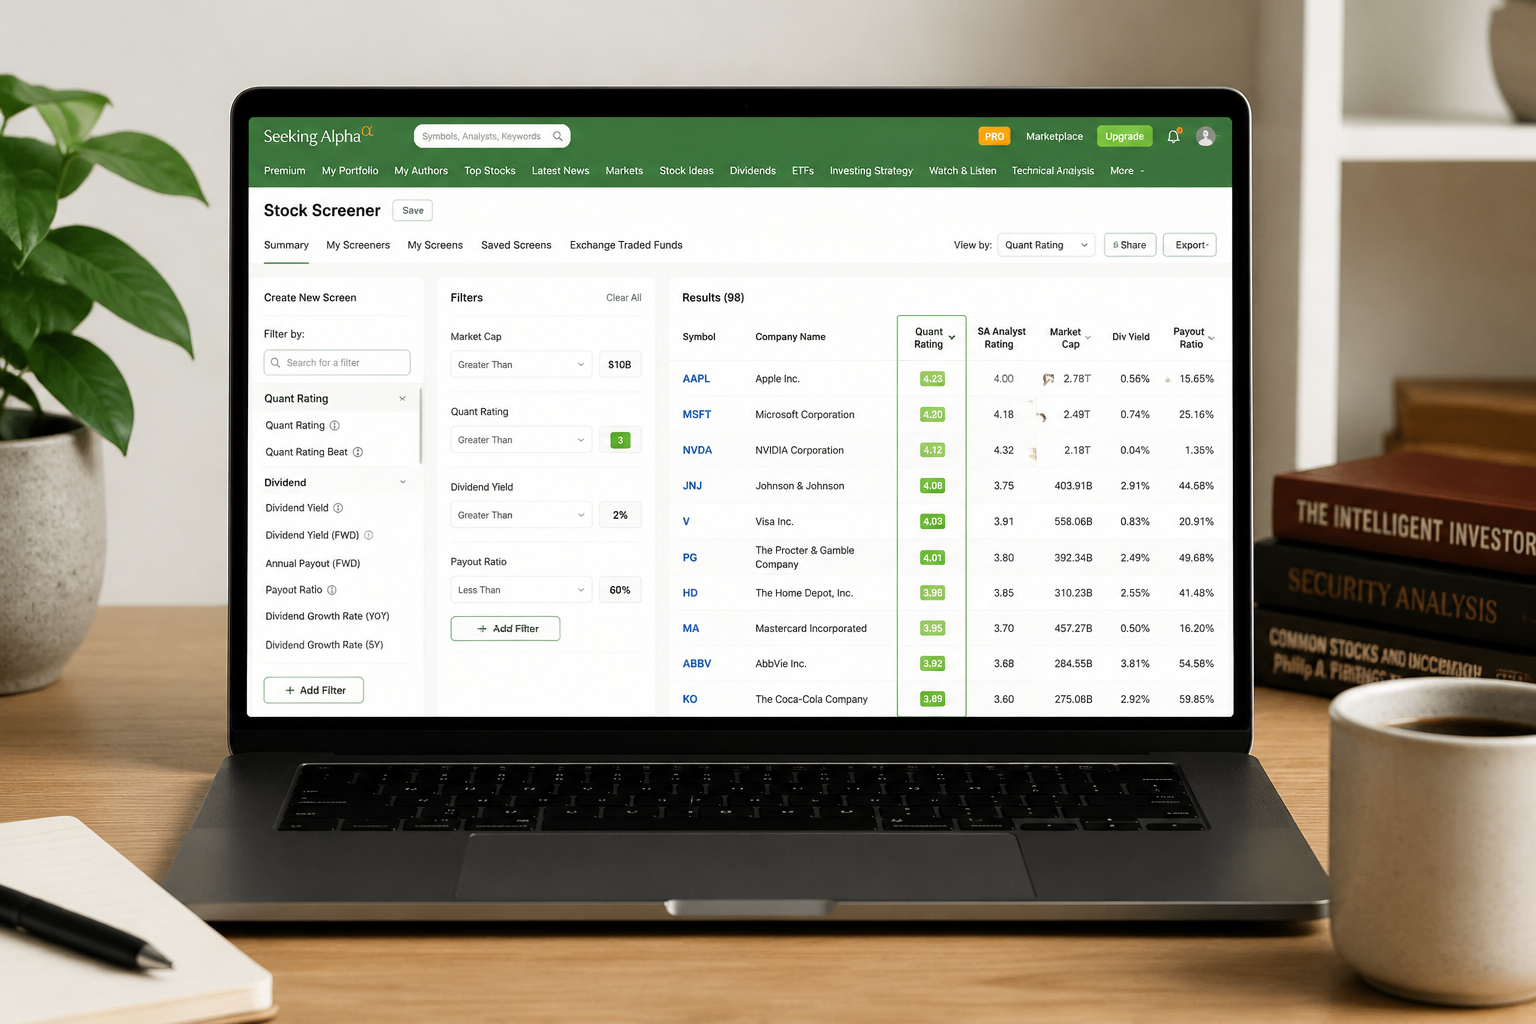
Premium unlocks the full screener with Quant Rating and Factor Grade filters. You can screen for, say, all S&P 500 stocks with a Value grade of A or better, a Profitability grade of B or better, and a Quant Rating above 4.0. That's a fundamentals screen built in minutes. The free tier doesn't give you this.
Contributor bull and bear cases
Tens of thousands of contributors publish analysis on Seeking Alpha. For almost any ticker with meaningful market cap, you'll find recent bull and bear cases written by investors who've done the work. The quality varies, more on that in the drawbacks section, but the breadth is genuinely useful. On a stock you're researching, reading the strongest bear case is often more valuable than reading another bull thesis.
Seeking Alpha Subscription Tiers: What You Pay
Prices verified against seekingalpha.com. Verify current pricing before purchasing, as promotional offers change.
| Plan | Introductory Price | Renewal Price | Headline Feature |
|---|---|---|---|
| Basic (Free) | $0 | $0 | Headlines, limited article access, basic portfolio tracking |
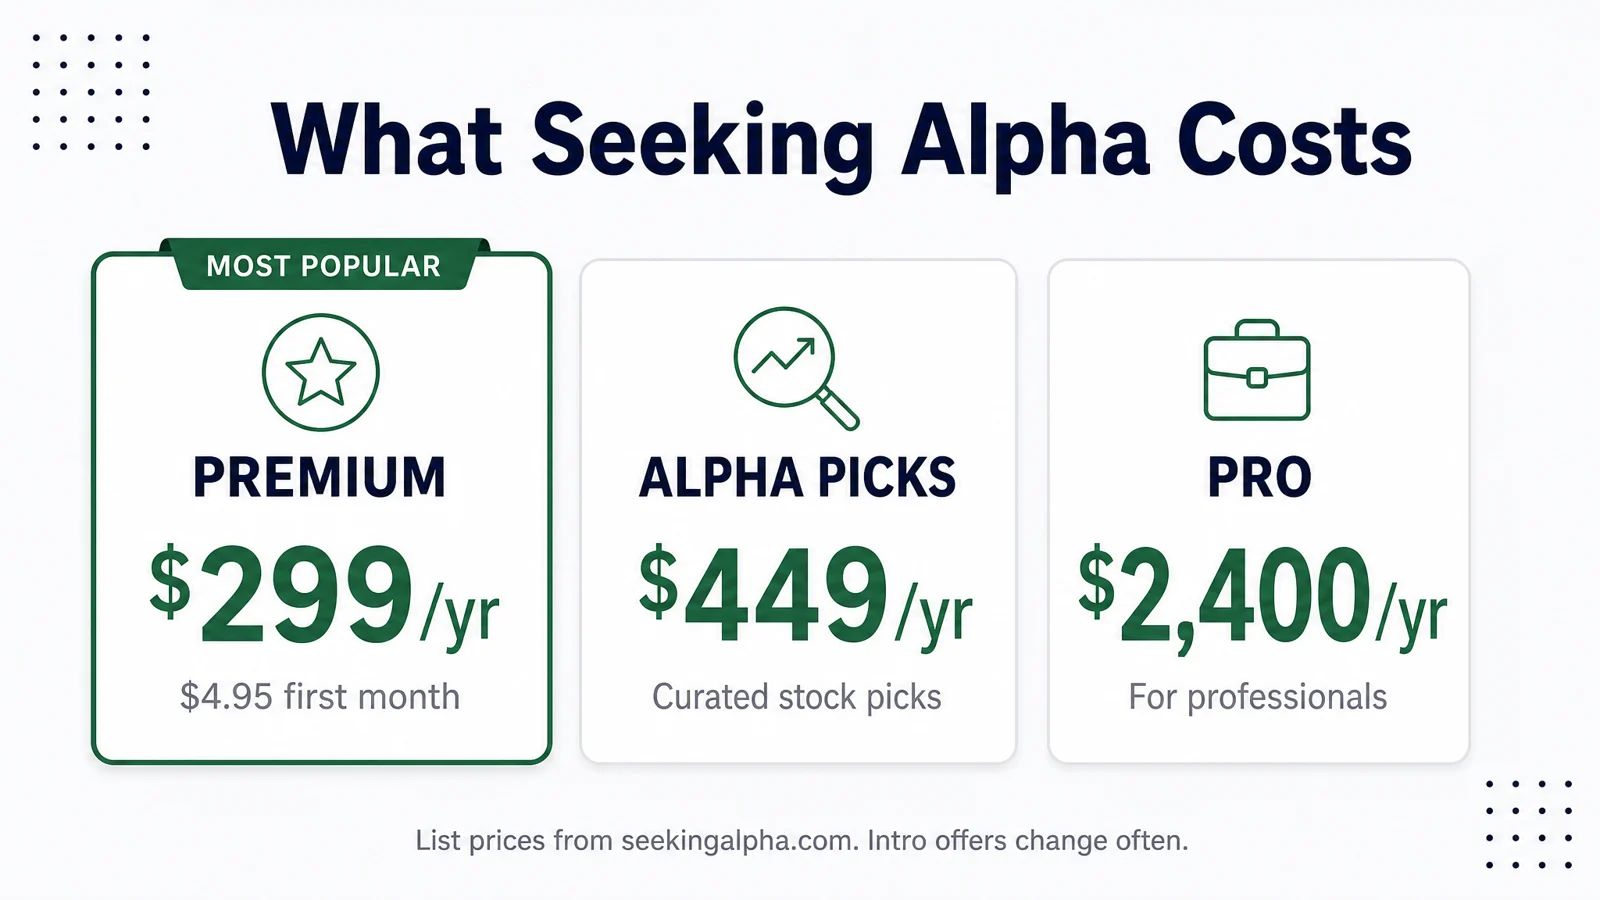
| Premium | $4.95 / first month | $299 / year | Quant Ratings, Factor Grades, full transcripts, 10-year financials, screeners |
| Alpha Picks | $449 / first year | $499 / year | Bi-monthly stock picks from a quant-screened shortlist |
| Pro | $99 / first month | $2,400 / year | Everything in Premium plus institutional-grade data tools |
The column that matters most for this audience is Renewal Price. That's the number you'll pay every year after the introductory period ends.
What Does Seeking Alpha Actually Cost After Year One?
This is the section the title promised, so here it is plainly.
Premium costs $299 per year after the introductory first month at $4.95. That's $24.92 per month on an annualized basis. The $4.95 introductory offer is real, it's one month of full Premium access at a steep discount. After that month, the subscription converts to the annual rate at renewal.
Alpha Picks costs $449 in year one and $499 per year on renewal. The step-up is modest, $50, but the renewal price is the one to budget for.
Pro costs $2,400 per year after a $99 introductory month. That's $200 per month. For a retail investor managing their own money, this is a professional-grade price point for professional-grade tools. Most readers of this review should skip it entirely.
The practical advice on timing and trials
The 7-day free trial on Premium is genuinely useful, but only if you use it deliberately. Here's how to get actual value from it:
- Pick three stocks you already know well and run the Factor Grades on each. Compare what you know about the business to what the grades say. If the grades match your fundamental view, the system is working as a useful cross-check. If they diverge, dig into why.
- Read one full earnings call transcript for a company you've been following. Compare it to the summary you read elsewhere. Notice what the summary left out.
- Run one screener using Factor Grade filters that match your investment style. See whether the output gives you names you'd actually want to research further.
If those three exercises produce useful results, the subscription earns its keep. If they don't change your process at all, cancel before the trial ends.
On timing a purchase: Seeking Alpha runs promotional pricing periodically, particularly around Black Friday and early January. If you're not in a rush, waiting for a promotional window can get you the annual Premium subscription at a meaningful discount from $299. The introductory $4.95 month is always available as an entry point regardless.
On auto-renewal: Subscriptions renew automatically and are non-refundable once charged. Put the renewal date in your calendar the day you subscribe. If you want to evaluate whether to continue, do that evaluation a week before renewal, not after the charge hits. This isn't a warning, it's just buying smart.
On downgrading: If you find you're using Premium primarily for the Factor Grades and transcripts but not the screeners or contributor analysis, the free tier still gives you headlines and limited article access. The question to ask before renewal is whether the paid features changed at least one investment decision in the past year. If yes, $299 is probably justified. If you can't point to a specific example, that's useful information.
Is Seeking Alpha Premium or Alpha Picks the Better Buy?
Premium is for the investor who does their own research. Alpha Picks is for the investor who wants a shortlist.
These are genuinely different products serving different needs, and conflating them is a common mistake.
Premium gives you the infrastructure to research any stock you want to look at. Quant Ratings, Factor Grades, transcripts, financials, screeners, contributor analysis, all of it is available, but you decide what to do with it. The platform is a research tool, not a recommendation service. If you enjoy the process of building a thesis, stress-testing it against the bear case, and making your own call, Premium is the right product.
Alpha Picks gives you a bi-monthly shortlist of stocks selected through a quant-screened process. You're not getting the research infrastructure, you're getting the output of someone else's process. If you want to spend less time on research and more time on execution, Alpha Picks is the more efficient choice. The trade-off is that you're trusting the methodology rather than building your own view.
The one most readers should start with is Premium. The 7-day free trial makes it a low-risk entry point. If you use the trial and find you want a shortlist rather than a research platform, you can evaluate Alpha Picks from there. Starting with Alpha Picks and discovering you actually want the research tools means paying for the wrong product first.
For a dividend or value investor who reads research before buying and holds positions for months or years, Premium is the better fit. The Factor Grades and dividend safety scoring are built for exactly that process.
The Alpha Score Breakdown
Seeking Alpha Premium, 75 / 100
Scores reflect hands-on testing of a paid Premium subscription.
| Pillar | Score |
|---|---|
| Signal Quality | 16 / 20 |
| Transparency | 14 / 20 |
| Price-to-Value | 13 / 20 |
| Usability | 16 / 20 |
| Community Verdict | 16 / 20 |
| Total | 75 / 100 |
Signal Quality: 16/20. The Quant Ratings and Factor Grades are the core output, and they hold up. The grades are recalculated daily, the financial data is accurate and deep, and the earnings transcripts arrive quickly. The signal is real. The 4-point gap from a perfect score reflects the fact that the quant methodology isn't fully auditable, and contributor signal quality is uneven.
Transparency: 14/20. Seeking Alpha publishes a general description of how the Quant Rating factors work, but the exact weighting and calculation logic is proprietary. You know what goes in; you don't know precisely how the model weighs it. For a research tool that positions itself as a data-driven alternative to human analyst bias, more methodological disclosure would strengthen the case.
Price-to-Value: 13/20. This is the weakest pillar, and it's driven almost entirely by the introductory-to-renewal gap. $4.95 for the first month is a legitimate entry point. $299 per year is a fair price for what Premium delivers. The problem is that the advertised number and the real number are far enough apart that buyers routinely feel surprised at renewal. A product that earns a 13 here isn't bad value, it's a pricing structure that creates unnecessary friction with its own customers.
Usability: 16/20. The interface is clean and the platform is genuinely usable on a daily basis. The Factor Grades are scannable at a glance. The screener is fast. The portfolio tracker is well-integrated. Mobile works. The slight deduction reflects the fact that the contributor article volume can be overwhelming, and there's no great way to filter for contributor quality before you've read enough to know which writers to trust.
Community Verdict: 16/20. Seeking Alpha has a large, active user base and consistently positive feedback on the research depth and Quant Rating system. Reddit threads in r/investing and r/stocks reflect genuine user satisfaction with the platform's data tools. The most common complaint across review platforms mirrors the pricing transparency issue, users surprised by the renewal price. That's a real pattern, which is why this article exists.
Sourced Stat Cards
$4.95, Seeking Alpha Premium introductory price (first month). Source: seekingalpha.com/subscriptions.
$299/year, Seeking Alpha Premium renewal price. Source: seekingalpha.com/subscriptions.
$499/year, Alpha Picks renewal price (first year: $449). Source: seekingalpha.com/subscriptions.
$2,400/year, Seeking Alpha Pro annual price after $99 introductory month. Source: seekingalpha.com/subscriptions.
7 days, Length of Seeking Alpha Premium free trial. Source: seekingalpha.com/subscriptions.
10 years, Financial statement history available on Premium. Source: seekingalpha.com product feature documentation.
Where Seeking Alpha Falls Short
A 75/100 score is a solid result. It's not a perfect one, and the gaps are worth naming clearly.
The introductory-to-renewal step-up
The single biggest structural problem with Seeking Alpha's pricing is the distance between the number they advertise and the number you pay in year two. $4.95 to $299 is a 60x step-up. That's not a bait-and-switch, the renewal price is disclosed, but it's a gap wide enough that a meaningful share of subscribers feel blindsided when the annual charge hits. The fix is simple: know the renewal price before you subscribe. This article exists because that number is harder to find than it should be.
Contributor quality is uneven
Seeking Alpha is an open publishing platform. Anyone can write, and tens of thousands of contributors do. That breadth is genuinely useful, you'll find analysis on small-cap names that no sell-side analyst covers. The trade-off is that the quality range is wide. A well-researched deep-dive from an experienced contributor sits next to a thin summary from someone who's been publishing for two weeks. The platform has a rating system for contributors, but it takes time to learn which writers are worth following. New subscribers often over-rely on contributor articles before they've developed that filter. The Quant Ratings and Factor Grades are consistent; contributor analysis is not.
The quant methodology is a partial black box
As noted in the Transparency pillar, Seeking Alpha publishes enough about the Factor Grade methodology to understand what it measures, but not enough to fully audit how it weights those measures. For most retail investors, this is a minor issue, the grades are useful as a screening tool regardless. For an investor who wants to understand exactly why a stock scored B+ in Value rather than A-, the answer isn't fully available. That limitation is worth knowing before you treat a Factor Grade as a definitive verdict.
Conclusion
Seeking Alpha Premium earns a clear recommendation for the fundamentals-driven, long-term investor who reads research before buying. The Quant Ratings and Factor Grades are the strongest case for subscribing, a consistent, daily-updated scoring system that removes analyst bias and gives you a common language across your entire watchlist. Add full earnings transcripts, ten years of financials, dividend safety scoring, and a portfolio tracker that surfaces relevant news on your holdings, and the $299 annual renewal is justified for anyone doing serious stock research.
Start with Premium, not Alpha Picks. The 7-day free trial is the right entry point. Use it to test the Factor Grades on three stocks you already know, read one full earnings transcript, and run the screener. If those exercises improve your process, subscribe. If they don't, cancel before the trial ends and you've lost nothing.
On timing: if you're not in a rush, watch for promotional pricing around Black Friday or early January. The introductory $4.95 month is always available, but promotional annual pricing can reduce the $299 renewal meaningfully. Whatever you pay, put the renewal date in your calendar the day you subscribe.
Worth it depends on what you're replacing. The FullStack Alpha directory has 200+ AI stock tools filterable by price, so you can see what the same money buys elsewhere.
Check the alternatives at aistockpickerapps.com
Disclosure: This review may contain affiliate links. If you subscribe through a link on this page, FullStack Alpha may earn a commission at no additional cost to you.
We test the tools. You get the verdict.
One email a week. What we tested, what scored, and what we'd skip. Written for traders, not for clicks.
Frequently asked
Topics in this teardown
Our verdict on Seeking Alpha
Seeking Alpha scores 75.