Danelfin vs Seeking Alpha: AI Score or Quant Rating
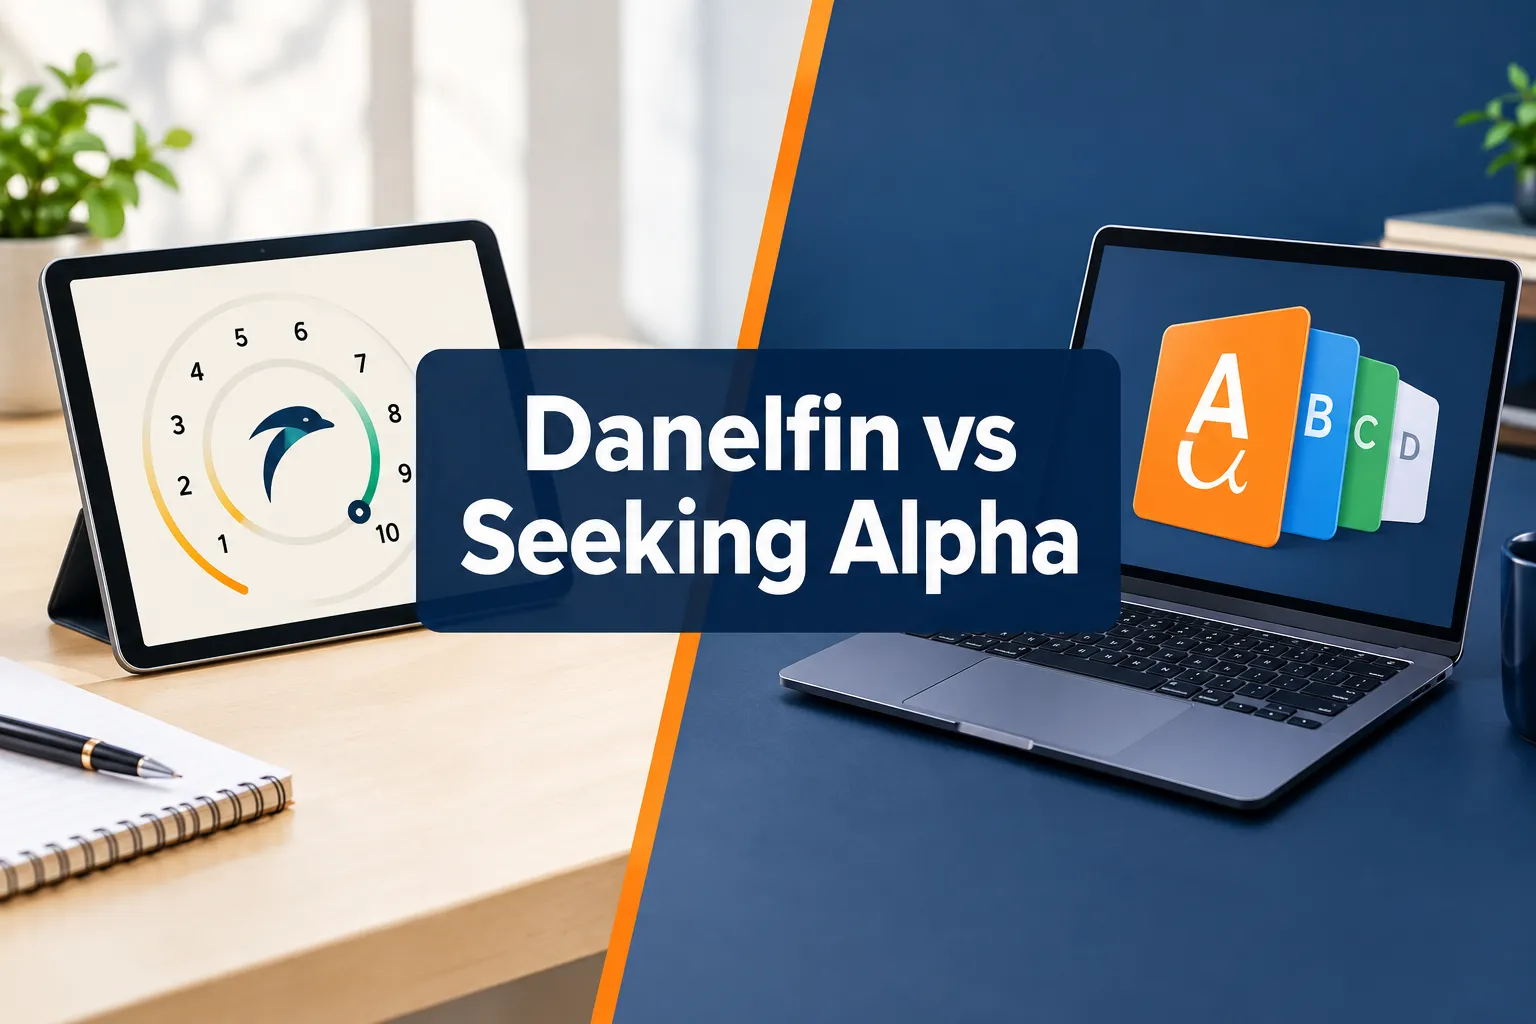
Danelfin wins on transparent, cheap AI scores, and Seeking Alpha wins on research depth. That's the short version of Danelfin vs Seeking Alpha: AI Score or Quant Rating, and both tools scored exactly 75 out of 100 on our Alpha Score with completely opposite shapes. One is a number you can audit. The other is a library you'll never finish reading.
Quick answer
Pick Danelfin if you want a single explainable 1 to 10 AI Score, a real free tier, and the cheapest path to a daily ranked stock list. Pick Seeking Alpha if you want A+ to F Quant Ratings sitting inside thousands of written articles, earnings transcripts, and a loud community arguing over every ticker. Danelfin starts at $0 and $22 a month for Plus. Seeking Alpha Premium runs roughly $299 a year after the first-year discount.
Key Takeaways
- Both score 75/100 on our Alpha Score, with opposite pillar shapes: Danelfin 19/20 Transparency but 9/20 Community Verdict.
- Danelfin cost: Free $0, Plus $22/mo, Pro $59/mo, Elite $134/mo on the official pricing page.
- Seeking Alpha Premium is reported around $239 first year, then $299/yr; Alpha Picks about $499/yr. Treat these as unverified, the official page was blocked.
- The Danelfin AI Score is a 1 to 10 probability that a stock beats the S&P 500 over the next three months.
- Quant Ratings grade Value, Growth, Profitability, Momentum, and EPS Revisions from A+ to F.
- Danelfin backtest claim: +376% from January 3, 2017 to June 9, 2025 vs +166% for the S&P 500. Backtest, not a live audited record.
- Trustpilot: Danelfin 3.5 from 37 reviews; Seeking Alpha 4.0 from 907. Apple App Store: Danelfin 4.91 from 11 ratings, Seeking Alpha 4.76 from 126,334.
Danelfin vs Seeking Alpha: which stock rating should you trust?
Trust the Danelfin AI Score when you need a fast, auditable ranking of which stocks have the best odds over the next quarter. Trust Seeking Alpha's Quant Rating when you want factor grades plus human analysis you can actually read and argue with. Neither is a trading system on its own.
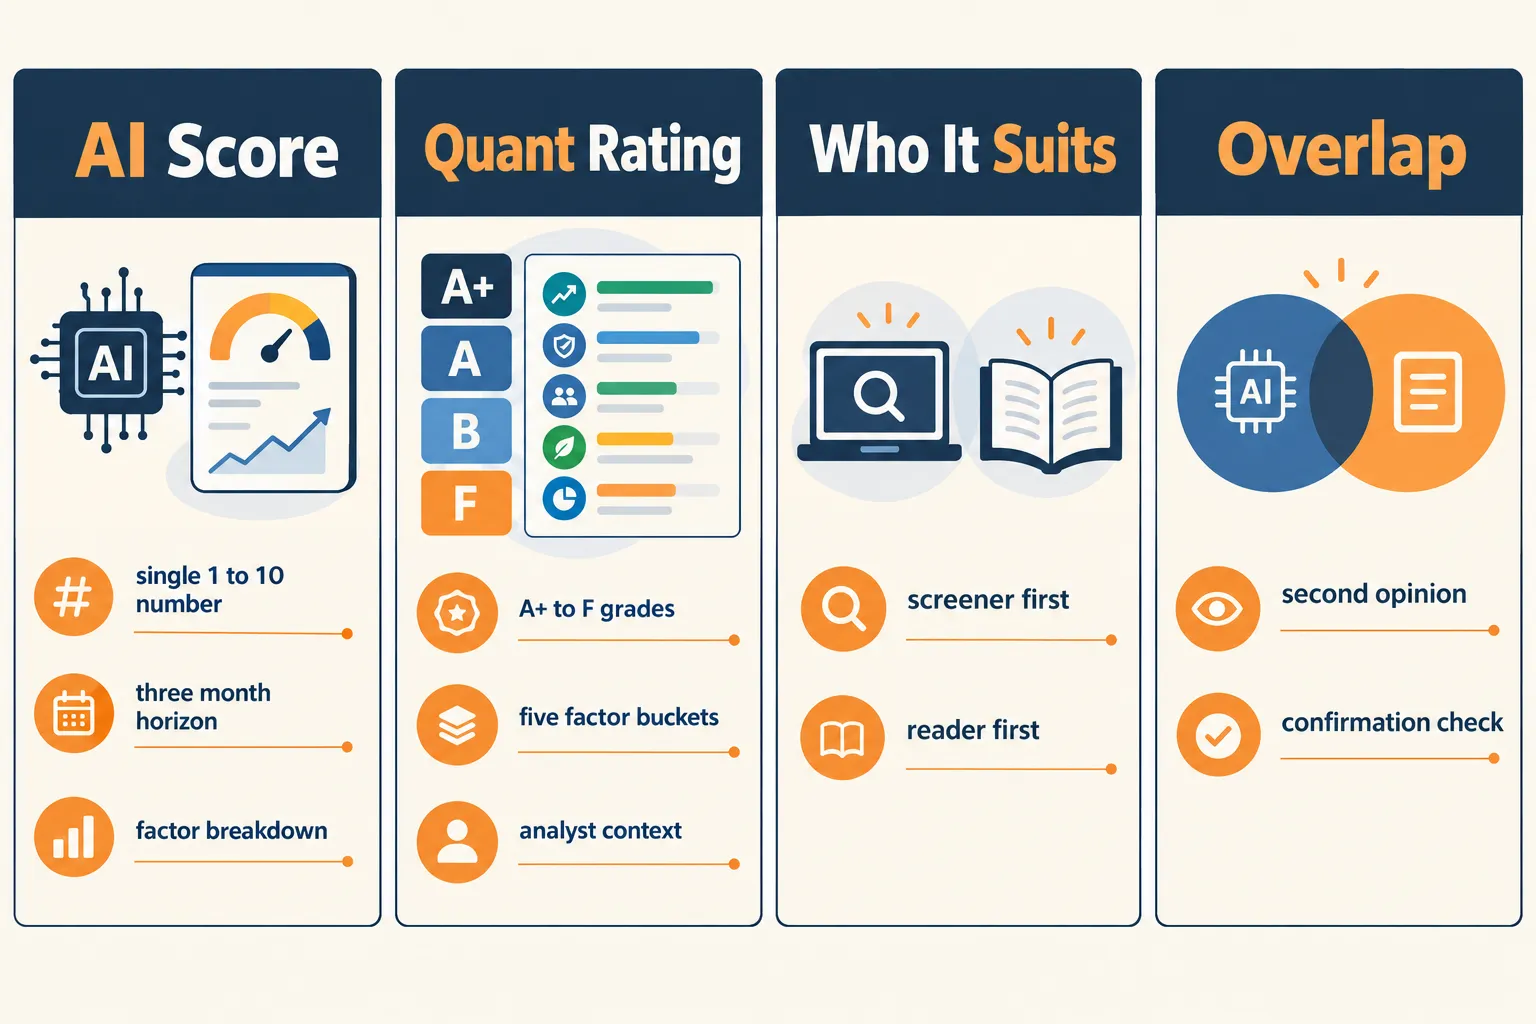
Most investors asking this question own the same problem: too many subscriptions, not enough process. One tool gives you a number. The other gives you a reading list. Pick based on how you actually make decisions, not on which marketing page looks smarter.
Danelfin at a glance
Best for: swing traders and long-term investors who want a second-opinion score.
- Day trader: Weak fit, scores update daily, not intraday.
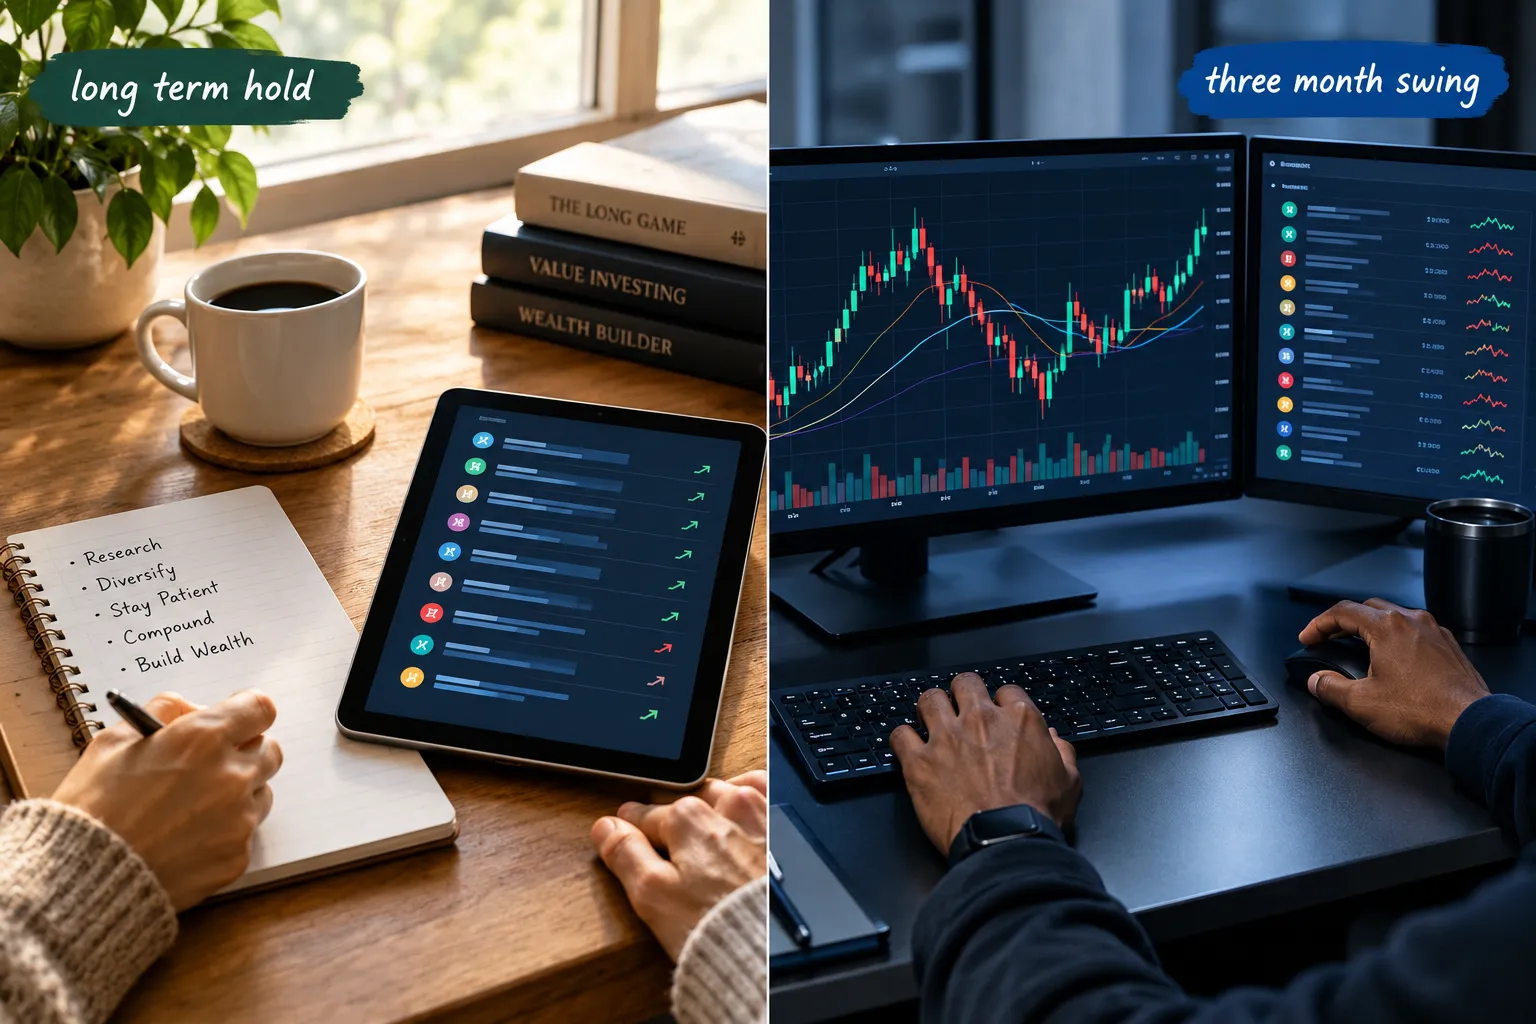
- Swing trader: Strong fit, three-month horizon matches hold time.
- Scalper: Weak fit, no tick data or live scanning.
- Long-term investor: Okay fit, useful as a quality filter.
Price: Free $0, Plus $22/mo.
What users say: Trustpilot 3.5 from 37 reviews, Apple App Store 4.91 from 11 ratings.
Watch out for: the headline record is a backtest, not an audited live track record.
What is Danelfin and who is it for?
Danelfin is an AI stock analytics platform that assigns every covered stock a 1 to 10 AI Score representing the probability it beats the S&P 500 over the next three months. It suits swing traders and self-directed long-term investors who want a quantified second opinion before buying.
The company behind it, Danelfin Technologies, S.L., is a Spanish fintech. Its primary industry is financial software, with sub industries in investment research and analytics, and verticals across fintech and artificial intelligence. The website is danelfin.com. Public funding data on the company stage and total amount raised is thin, and most of it sits behind subscriber access only on platforms like Preqin Pro, which tracks private markets research across multiple asset classes. You can see current investors listed in some private markets databases, but Preqin and similar data providers keep the details gated.
Worth noting for credibility: Danelfin picked up recognition at the Benzinga Global Fintech Awards, which is a real industry stage, not a paid badge mill.
)
Who it's not for: scalpers and day traders. Daily score updates are useless if your hold time is 11 minutes.
What is Seeking Alpha and who is it for?
Seeking Alpha is a crowd-sourced investment research platform where thousands of contributor articles sit alongside an algorithmic Quant Rating system. It suits investors who read, who want written theses, earnings call coverage, and a community that pushes back.
The platform's data layer includes financials, dividend history, ETFs and single-stock screeners, and the Quant Ratings themselves. Its real asset is volume: news, analysis, and comment threads with real disagreement. If your process involves reading two bear cases before you buy, this is your tool. Our full breakdown lives in the Seeking Alpha tool profile.
Decision rule: if you've paid for research in the past and never read it, Seeking Alpha will repeat that mistake at a higher price.
How does the Danelfin AI Score work?
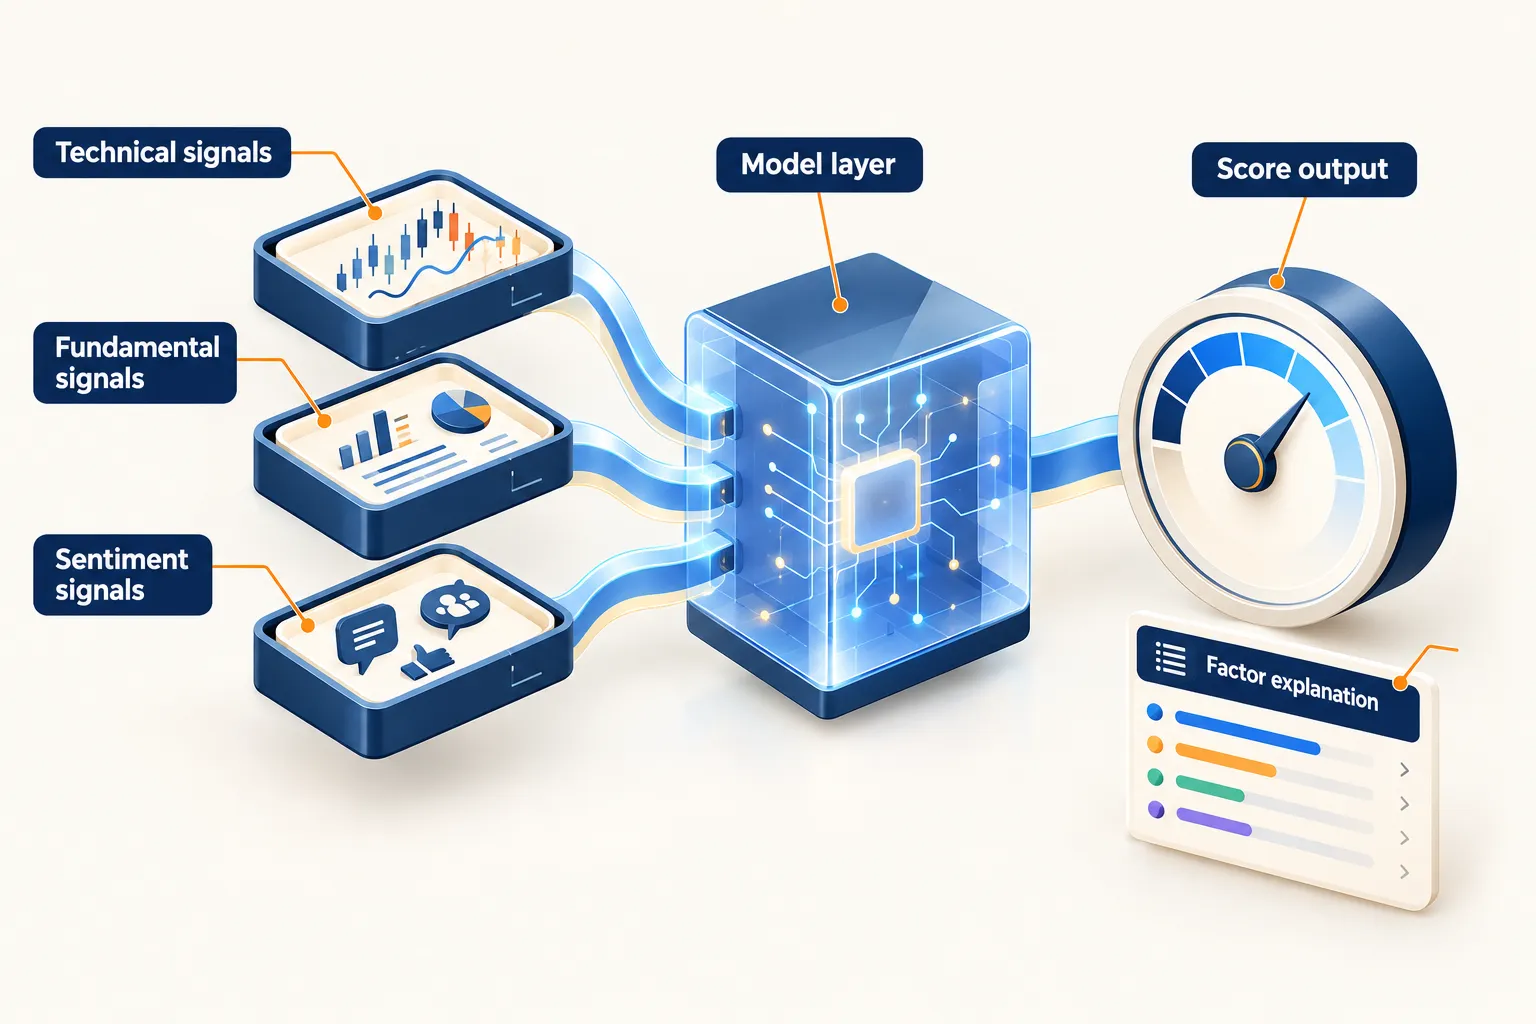
The Danelfin AI Score runs hundreds to over 10,000 daily features per stock across technical, fundamental, and sentiment data, then outputs one number from 1 to 10. A 10 means the model gives that stock the highest probability of beating the S&P 500 over the following three months.
What makes it different from most AI stock scores is the explanation layer. Each score breaks into sub-scores so you can see which signal families drive it. Independent coverage of the Danelfin AI Score methodology confirms the probabilistic framing and the factor breakdown, plus optional AI Price Forecasts at 1, 3, 6, and 12 months.
)
Three things to understand before you act on a 10:
- It's a probability, not a prediction. A 10 is a tilt in your favor, not a promise.
- It's relative to the S&P 500, so in a broad drawdown a top score can still lose money while "winning."
- Scores refresh daily after market close, so the ranking you see tomorrow morning reflects yesterday's data.
We dug deeper into whether this number actually holds up in our piece on whether the Danelfin AI Score can beat the market.
How often does Danelfin update its AI scores?
Daily, after the close. New AI Scores and rankings post each trading day, and Elite subscribers can request historical daily scores back to 2017, which is genuinely useful if you want to test the signal yourself instead of taking the vendor's word for it.
How do Seeking Alpha Quant Ratings work?
Seeking Alpha's Quant Rating is a rules-based factor model that grades each stock from A+ to F across at least five dimensions: Value, Growth, Profitability, Momentum, and EPS Revisions. Those grades roll into a Strong Buy through Strong Sell headline rating.
The company's own Quant Ratings and Factor Grades FAQ explains that grades are relative to sector peers, which matters a lot. An A+ on Value inside energy is a different animal than an A+ on Value inside software.
Where it lags: factor models built on reported fundamentals and revisions are slow to react to sudden sentiment shifts. A stock can carry a Strong Buy into a news event that nukes the thesis. Reviewers covering both platforms flag this as the main structural weakness of grade-based systems.
Where it shines: the grades are legible. "F on Value, A on Momentum" tells you exactly what kind of trade you're taking. That's more actionable than a single composite number for an investor building a diversified sleeve.
Danelfin cost vs Seeking Alpha cost: is Danelfin free?
Yes, Danelfin is free at the entry level. The Free plan costs $0 and gives you 10 reports a month, the top 10 names in the rankings, and one portfolio. Paid tiers run $22, $59, and $134 a month.
The official Danelfin annual pricing page lists Plus at $264 a year, Pro at $708, and Elite at $1,608, roughly a 25% discount against monthly billing. There's a 14-day free trial on paid tiers and a 30-day money-back guarantee, which independent reviews of Danelfin's plan structure also confirm. Developers and quants should see the separate Danelfin API pricing, which starts around $52 a month and scales to roughly $449 a month for high-volume request quotas. Elite is the tier built for a developer, with unlimited portfolios and historical score access.
Seeking Alpha is the pricier side of this comparison. Third-party coverage puts Premium at about $239 for year one then $299 a year, Alpha Picks near $499 a year, and Pro around $2,400. Treat all three as unverified: the official pricing page was blocked during our check, so confirm on Seeking Alpha's own site before you pay. Comparison roundups of the best AI investing apps list both platforms and describe the same price gap.
Decision rule: if your total tool budget is under $300 a year, Danelfin Plus plus a free news source beats a single Seeking Alpha Premium seat.
Do their performance claims hold up?
Both headline numbers are marketing, not audited proof. Danelfin advertises +376% from January 3, 2017 until June 9, 2025, versus only +166% for the S&P 500, and labels it a backtest. Seeking Alpha's Alpha Picks promotes "+400% Gains vs. S&P 500" with a method we could not verify.
A backtest is a model run over history that already happened. It tells you the rules were fitted to the past. It does not tell you the signal survives live capital, slippage, and your own hesitation. One independent review of Danelfin's smart score claims reaches the same conclusion: use it as an input, not an oracle.
)
That's also where one of the sharper Trustpilot reviews lands, from a user who ran their own check:
"I subscribed Jan-Jun 2026 and tested 55 of their top-rated picks...Only 10 beat the market over 3 months."
Trustpilot reviewer, trustpilot.com/review/danelfin.com
Play stupid games with a backtest and you win stupid prizes. Paper trade either rating for 30 days before you size up.
Top 5 Favorite Features in Danelfin vs Seeking Alpha
The five features that actually change a decision: Danelfin's explainable AI Score and its free tier, Seeking Alpha's written research and Quant factor grades, and on both sides, a usable screener and mobile app.
- Danelfin AI Score with factor breakdown. A 1 to 10 number you can take apart. Highest transparency on our board.
- Seeking Alpha Factor Grades. A+ to F across Value, Growth, Profitability, Momentum, EPS Revisions, graded against sector peers.
- Danelfin Free plan and trade idea of the week. 10 reports a month at $0, plus a weekly trade idea, so you can test before paying.
- Seeking Alpha news and content depth. Contributor articles, transcripts, ETF coverage, and comment threads that stress-test a thesis.
- Both ship real mobile apps. Danelfin's iOS app hit v1.7.0 on 2026-09-23 with bug fixes and interface work, rated 4.91 from 11 ratings on the Danelfin App Store listing. Seeking Alpha's app sits at 4.76 from 126,334 ratings, available in English and other regional storefronts including Europe, Asia Pacific, Latin America and the Caribbean, Africa, Middle East, and India, and the United States and Canada. App Privacy disclosures on both list Data Linked to You and Data Not Linked to You categories, and each publishes a privacy policy and accessibility information. Apple Inc and Google both require those labels, so read them before you sign up and manage permissions in your account settings.
What we like and don't like about Danelfin
Danelfin's strength is honesty about its own model; its weakness is that almost nobody is talking about it. Both things are true in the same product.
Pros
- Transparency scored 19/20, the highest on our board. The factor split is visible.
- A real free tier, not a 7-day tease.
- Plus at $22/mo undercuts almost every comparable AI scoring service.
- Daily refreshed rankings and 1M, 3M, 6M, 1Y price forecasts.
Cons
- Community Verdict scored 9/20. Public discussion is thin. 37 Trustpilot reviews and 11 App Store ratings is not a sample you can lean on.
- The headline +376% figure is a backtest. There is no audited live record to check.
- No intraday data, so day traders and scalpers get little from it.
Watch out for
A 10/10 AI Score is a three-month probability versus the S&P 500. It is not a buy signal, a price target, or a reason to skip your stop loss. Several reviewers describe the model as still effectively a black box despite the factor breakdown.
What we like and don't like about Seeking Alpha
Seeking Alpha's strength is volume of research and a community that actually argues; its weakness is price and a method that's less open than Danelfin's.
Pros
- Massive written research library plus transcripts and ETF coverage.
- Factor Grades are legible and peer-relative.
- 126,334 App Store ratings and 907 Trustpilot reviews mean the sentiment is real, not a campaign burst.
Cons
- Price-to-Value scored 13/20. At roughly $299 a year for Premium, you're paying for research you may never open.
- Transparency scored 14/20. The Quant method is documented but the weightings aren't fully open.
- Recurring complaints about interface bugs and account friction.
What do Danelfin reviews and Seeking Alpha users say?
Danelfin reviews are sparse but mostly describe it as a verification tool. Seeking Alpha users praise the content freshness and complain about the app. We combine Reddit, Trustpilot and Apple App Store sentiment with our five-pillar Alpha Score, and here the two sources disagree in a useful way.
On Danelfin, one Trustpilot reviewer framed it exactly how we'd recommend using it:
"It's a 'double-check before you buy' tool."
Trustpilot reviewer, trustpilot.com/review/danelfin.com
On Seeking Alpha, the App Store split is clear. One reviewer: "Seeking Alpha has up to date information that is updated with recent events". Another, less happy: "Your password reset does not work. The UI bugs out. On desktop and in the app." Both appear on the Seeking Alpha App Store listing.
Where users and our score agree: Danelfin's low public discussion volume matches its 9/20 Community Verdict, and Seeking Alpha's 16/20 matches its large, mixed, unsolicited review base. Reddit threads on Danelfin are few and short, which is itself the finding. Neither rating set looks campaign-shaped to us. Danelfin's 4.91 App Store average comes from only 11 ratings, so it's too small to read as a trend either way.
Seeking Alpha alternatives and Danelfin competitors
If neither fits, the closest rivals are Zen Ratings, Kavout, VectorVest, and Quiver Quantitative. Each solves a different slice of the same problem.
- Zen Ratings for A to F letter grades with a cheaper entry than Seeking Alpha.
- Kavout's K Score for investors curious whether institutional-style AI helps retail.
- VectorVest for a rating system with timing built in.
- Quiver Quantitative for alternative data like congressional trades.
- AlphaSense for document-heavy research closer to the institutional end.
Our three-way head-to-head on Danelfin vs Zen Ratings vs Kavout covers the scoring differences in detail. Looking for automation instead? Trading bots and broker APIs live on our sister site aistocktradingbots.com. TradingView, TrendSpider, Trade Ideas, AInvest and Tickeron all get covered in the directory too, and they solve charting and scanning rather than rating.
Related searches worth your time: Danelfin reviews, Danelfin AI, and Danelfin vs Seeking Alpha comparisons that actually quote prices.
Can you use Danelfin and Seeking Alpha together, and who should?
Yes, and for many investors that's the best answer. Use the Danelfin AI Score as the quantitative filter and Seeking Alpha as the qualitative check, in that order, so you spend reading time only on names that already rank.
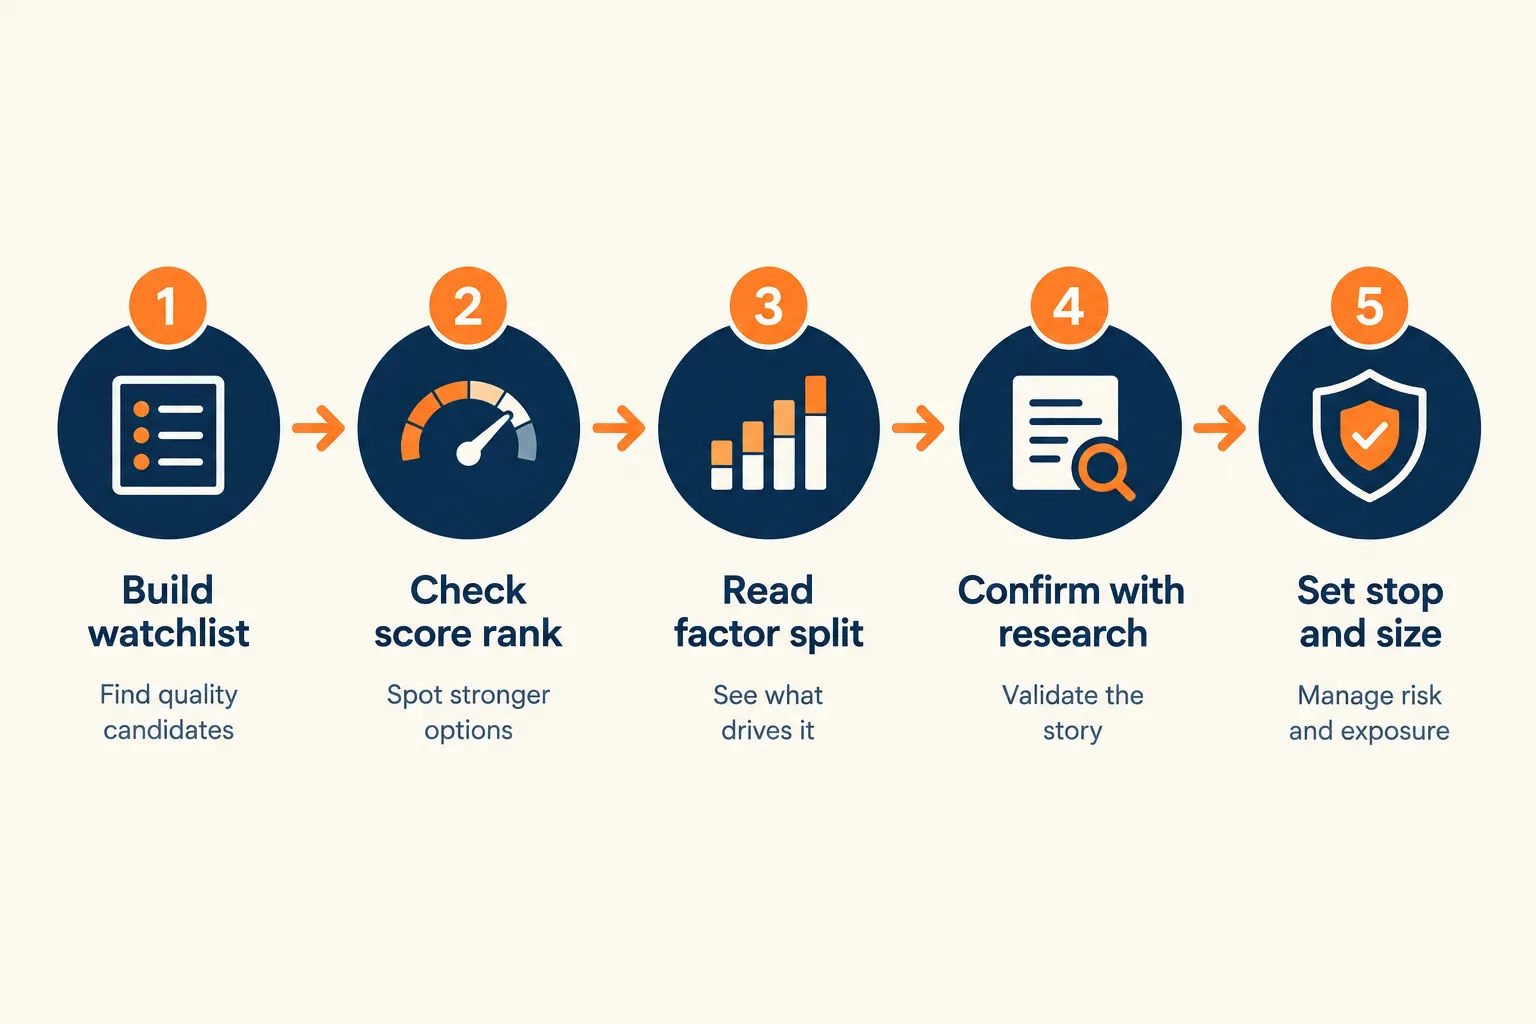
A five-step workflow that respects both tools:
- Pull the top-ranked names from Danelfin's daily list.
- Note the factor split. Momentum-driven 10s behave differently from fundamentals-driven 10s.
- Check the Seeking Alpha Quant Rating. Conflicting signals mean slow down, not stop.
- Read one bull and one bear article before sizing.
- Set position size and stop loss before entry, not after.
)
Beginners vs experienced: beginners get more from Danelfin's free plan and single number, because analysis paralysis kills more small accounts than bad picks do. Experienced investors get more from Seeking Alpha, because they already know what to do with a Value grade of F.
For day trading or long-term investing? Neither tool is a day trading product. Danelfin's three-month window fits swing trading and position trading. Seeking Alpha fits long-term investing. Scalpers should skip both. Our free Stock Health Scorecard is a no-cost starting point if you want to test the habit first.
Common mistakes with Danelfin ratings: treating a 10 as a buy order, ignoring the three-month horizon, buying all ten top names and calling it a portfolio, and judging the model after two weeks. Also: chasing a name that's already overextended because the score is high. A score is not a clean setup, and price action still decides your entry.
How do Danelfin and Seeking Alpha compare on price, features and fit?
Four tables, one decision. Price first, then rivals, then features, then trader fit.
| Plan | What you get | Best for | Price |
|---|---|---|---|
| Danelfin Free | 10 reports/mo, top 10 ranks, 1 portfolio | Testing the workflow | $0 |
| Danelfin Plus | Full AI Score access, forecasts | Most individual users | $22/mo, $264/yr |
| Danelfin Pro | Deeper screening, more portfolios | Active swing traders | $59/mo, $708/yr |
| Danelfin Elite | Unlimited portfolios, history to 2017, API expert | Quants and developers | $134/mo, $1,608/yr |
| Seeking Alpha Premium | Quant Ratings, Factor Grades, research | Readers and long-term investors | ~$299/yr (unverified) |
| Tool | Best for | Key strength | Key weakness | Starting price |
|---|---|---|---|---|
| Danelfin | Explainable AI scores | Factor breakdown | Thin user base | $0 |
| Seeking Alpha | Research depth | Community + content | Price, app bugs | ~$239 yr 1 |
| Zen Ratings | Letter-grade simplicity | Low entry cost | Less written analysis | See tool page |
| Kavout | Institutional-style AI | K Score ranking | Opaque method | See tool page |
| Feature | Which tool has it | Our note |
|---|---|---|
| Single composite score | Danelfin (1 to 10) | Fastest to act on |
| Peer-relative factor grades | Seeking Alpha | Better for sector context |
| Free usable tier | Danelfin | 10 reports a month at $0 |
| Written analyst coverage | Seeking Alpha | Its real moat |
| API for developers | Danelfin | From ~$52/mo |
| Trader type | Pick | Why |
|---|---|---|
| Day trader | Neither | No intraday signal |
| Swing trader | Danelfin | 3-month horizon fits |
| Scalper | Neither | Wrong timeframe entirely |
| Long-term investor | Seeking Alpha | Research depth wins |
How the Alpha Score rates Danelfin and Seeking Alpha
Both land on 75 out of 100 with mirror-image pillar shapes. Danelfin earns the highest Transparency score on our board and the lowest Community Verdict. Seeking Alpha is the opposite.
The Alpha Score Breakdown
Signal Quality: Danelfin 16/20 | Seeking Alpha 16/20
Transparency: Danelfin 19/20 | Seeking Alpha 14/20
Price-to-Value: Danelfin 15/20 | Seeking Alpha 13/20
Usability: Danelfin 16/20 | Seeking Alpha 16/20
Community Verdict: Danelfin 9/20 | Seeking Alpha 16/20
Total: Danelfin 75/100 | Seeking Alpha 75/100
The score comes from FullStack Alpha desk research plus public user sentiment, and the pillar split is provisional. More on our method on the About FullStack Alpha page, and the full profile sits on the Danelfin tool page.
FullStack Alpha scorecards
Every tool in this article has a full scorecard: pricing, pros and cons, verified user quotes and the Alpha Score breakdown.
FAQ
How much does Danelfin cost?
Danelfin costs $0 on the Free plan, $22 a month for Plus ($264 a year), $59 a month for Pro ($708 a year), and $134 a month for Elite ($1,608 a year) on the official pricing page. Paid tiers include a 14-day free trial and a 30-day money-back guarantee. API access is priced separately from about $52 a month.
What is the best AI for picking stocks?
There is no single best AI stock picker, because the right tool depends on your holding period. Danelfin suits swing traders wanting an explainable three-month probability score. Seeking Alpha's Quant Ratings suit long-term investors who read research. Zen Ratings and Kavout cover similar ground. Treat every score as one input inside your own risk rules.
What makes Danelfin unique?
Danelfin's differentiator is explainability. Its AI Score is a 1 to 10 probability that a stock beats the S&P 500 over three months, built from thousands of daily features, and every score breaks into visible sub-scores showing which technical, fundamental, and sentiment signals drive it. That earned the highest Transparency pillar score, 19 out of 20, on our board.
Will C3 AI stock go up?
Nobody can tell you that, and any tool promising a direction is selling confidence, not analysis. Neither Danelfin nor Seeking Alpha predicts prices with certainty. Danelfin gives a probability of market outperformance over three months; Seeking Alpha gives factor grades. Check the current rating yourself, size the position small, and set a stop loss.
Is Danelfin free?
Yes, partly. The Free tier costs $0 and includes 10 stock reports a month, the top 10 names in the AI Score rankings, and one portfolio. Full rankings, screening, and price forecasts require a paid plan starting at $22 a month. Paid tiers add a 14-day free trial, so you can test without immediate commitment.
Is Seeking Alpha worth it?
Worth it depends on whether you read. At roughly $299 a year for Premium, the value sits in thousands of contributor articles, transcripts, and Quant Factor Grades. If you've paid for research before and never opened it, that money buys guilt. Its 13/20 Price-to-Value pillar reflects exactly that risk.
Is Danelfin better than Seeking Alpha?
Neither is better, they tie at 75 out of 100 with opposite strengths. Danelfin is more transparent and far cheaper, with a usable free plan. Seeking Alpha has deeper research and a much larger verified user base, 126,334 App Store ratings versus Danelfin's 11. Pick based on whether you want a score or a library.
Final Verdict: AI Score or Quant Rating?
Choose the Danelfin AI Score if you want a cheap, auditable number and a free way to start. Choose Seeking Alpha's Quant Rating if you read research and want factor grades plus a real community. Running both, Danelfin to filter and Seeking Alpha to verify, is the strongest setup for a swing trader who also holds long-term positions.
Danelfin's 19/20 Transparency is the reason it's on our board at all, and its 9/20 Community Verdict is the reason we won't oversell it. Fewer tabs, one process, data over noise.
Still can't tell which rating system fits how you actually trade?
Two tools compared here. 200+ catalogued in the FullStack Alpha directory, sorted by category, price and use case.
Conclusion: your next three steps
Start free, test one rating for 30 days, then decide with your own data instead of a vendor backtest.
- Open the Danelfin free account and pull the top 10 ranks. Zero cost, zero commitment.
- Paper trade 10 top-scored names with a fixed position size and a stop loss for one quarter.
- Only then add Seeking Alpha if your bottleneck turns out to be research depth, not signal.
Discipline beats prediction. A score without rules is just weather.
This is education, not financial advice.
Your market edge starts with the right tool. Stay alpha.
Some links on this page may earn FullStack Alpha a commission at no cost to you.
We test the tools. You get the verdict.
One email a week. What we tested, what scored, and what we'd skip. Written for traders, not for clicks.
More from FullStack Alpha