

The 3 Factors Behind Every Danelfin Stock Rating
Short on time? The Danelfin Alpha Score scorecard breaks the 75/100 down by pillar, with pricing and the verdict, in about 90 seconds.
See the score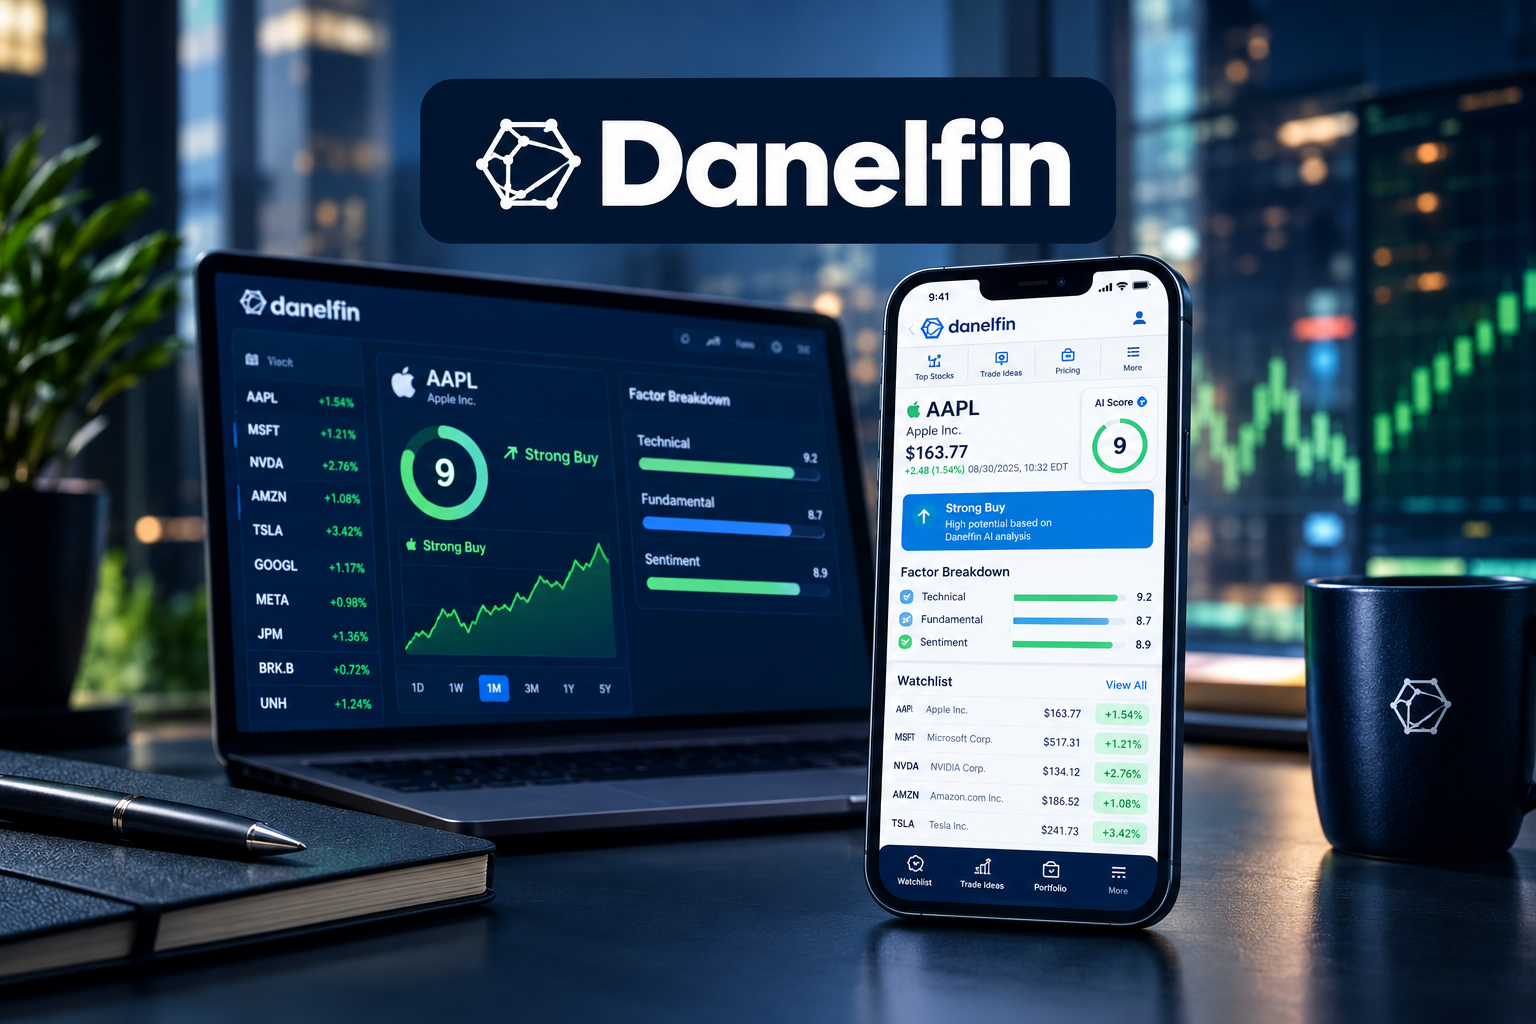
Quick Answer: Danelfin assigns every covered US stock and ETF an AI Score from 1 to 10 based on three factor groups: roughly 600 technical indicators, roughly 150 fundamental indicators, and roughly 150 sentiment indicators. The score represents the probability of beating the market over a 3-month horizon, not a price target. Technical indicators account for approximately two-thirds of the model's daily inputs, which makes this a momentum-weighted tool first, regardless of how it's marketed.
Key Takeaways
- The AI Score (1 to 10) measures the probability a stock beats the market over a 3-month horizon, it is not a price prediction and Danelfin says so explicitly.
- 900-plus daily indicators are grouped into three factors: roughly 600 technical, roughly 150 fundamental, and roughly 150 sentiment, a 60/15/15 split that makes technical analysis the dominant engine.
- The 600/150/150 factor split is publicly disclosed, which is genuinely rare in this category and the main reason this review exists.
- The free plan costs $0 forever with no credit card required, covering daily top-10 rankings, up to 10 monthly reports, and one portfolio capped at 5 holdings.
- Paid plans start at $22/month (Plus, billed annually); a 14-day free trial and a 30-day money-back guarantee apply to all paid tiers.
- Self-reported performance figures show 10/10-rated stocks outperforming by +21.05% annualized alpha and a Best Stocks strategy returning +376% from January 2017 to June 2025, neither figure has been independently audited.
Introduction
Most AI stock tools say "proprietary" and stop talking. They hand you a score, a color, maybe a percentile rank, and ask you to trust the black box. Danelfin does something different: it publishes the factor split behind every rating. That transparency is rare enough to be the reason this Danelfin review exists.
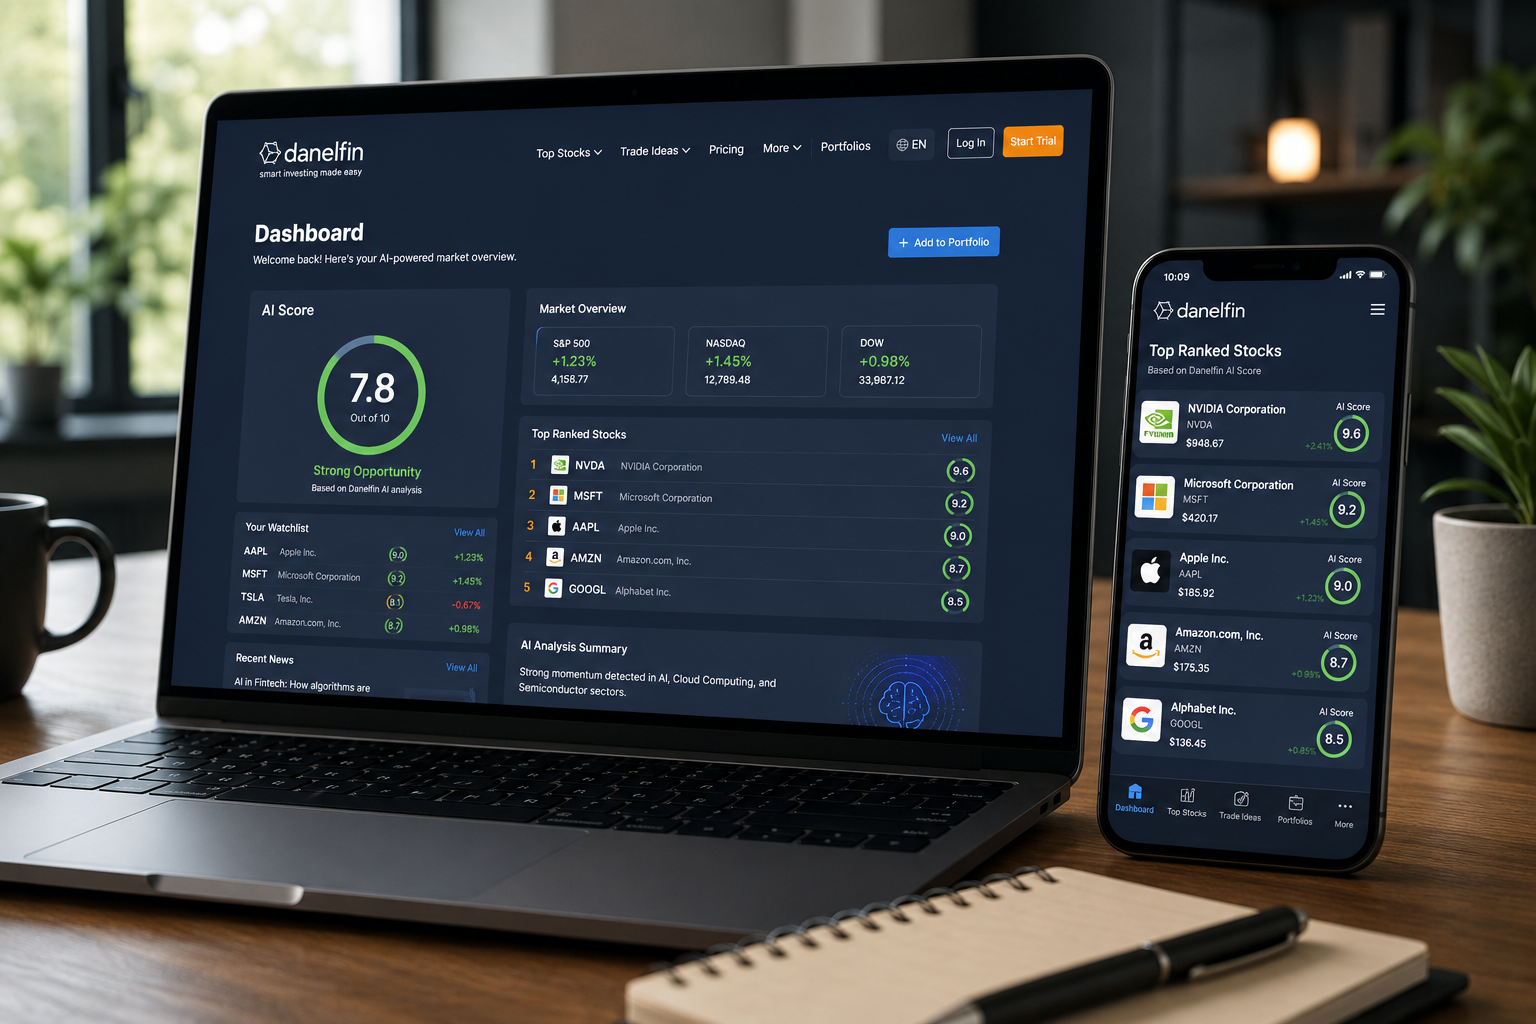
The three factors are technical, fundamental, and sentiment. Each one feeds a different slice of the more than 900 daily indicators the model processes per stock. This article will weigh each factor, explain what it actually measures, and tell you what the imbalance between them means before you act on a Danelfin AI Score.
That last part matters. Knowing a score exists is not the same as knowing what it's measuring. A tool that's two-thirds technical analysis behaves differently from one that balances all three factors equally. If you're buying this as a fundamentals-first screen, you should know what you're actually getting.
What Is the Danelfin AI Score, and What Does 1 to 10 Actually Mean?
The Danelfin AI Score is a probability estimate, not a price target. A score of 10 means the model's historical pattern recognition suggests that stock has a high probability of outperforming the broader market over the next three months. A score of 1 means the opposite. The scale is ordinal, 10 is better than 9, which is better than 8, but the gaps between numbers are not uniform dollar amounts or guaranteed percentage moves.
Danelfin states this plainly in its own documentation: "Our AI calculates probabilities based on past market behavior and does not calculate or predict actual results." That disclaimer is not fine print designed to be ignored. It is the correct description of what the tool does.
Why the 3-month window matters
Three months is a swing-to-medium-term horizon. It is long enough for a fundamental catalyst to show up in price action, short enough that macro regime changes can blow up a clean setup. For a self-directed investor holding positions for one to six months, that window is a reasonable fit. For a day trader, it is useless, the model is not scoring intraday momentum. For a buy-and-hold investor with a five-year view, it is equally irrelevant, three months of probability signal does not tell you whether a business compounds well over a decade.
The 3-month horizon also means the score needs to be refreshed. A 10 today can be a 6 in six weeks if the technical pattern breaks. This is not a set-and-forget rating.
Who the window excludes
Day traders are outside it on the short end. Long-term index investors are outside it on the long end. The reader this tool genuinely serves is someone actively managing a portfolio of individual stocks on a one-to-six-month horizon who wants a systematic second opinion before committing capital.
Danelfin Review: The 3 Factors Behind Every Stock Rating
Do the arithmetic first. More than 900 daily indicators, split roughly 600/150/150. Technical accounts for approximately 600 of those, about two-thirds of the model's daily inputs. Fundamental and sentiment each account for roughly 150, or about one-sixth each.
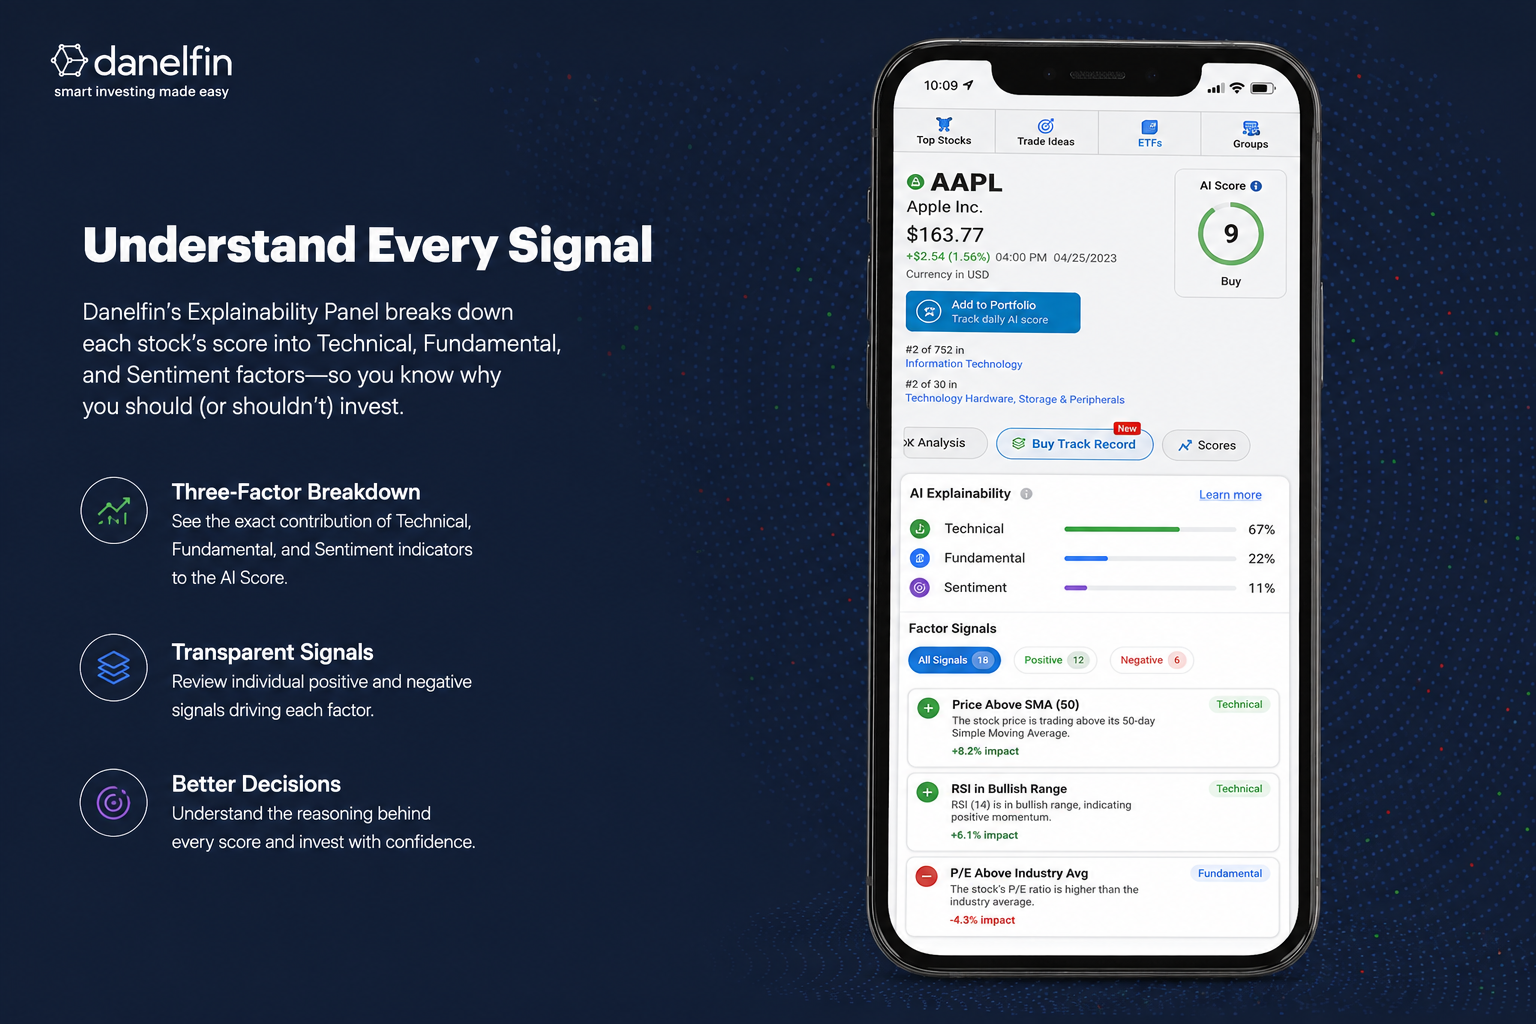
That is not a balanced three-factor model. That is a momentum-weighted model with fundamental and sentiment layers on top. The reader deserves to know that before they act on a Danelfin AI Score.
Factor 1: Technical, roughly 600 daily indicators
Technical indicators measure price and volume behavior. Moving averages, relative strength, momentum oscillators, breakout patterns, volatility measures, support and resistance levels, these are the building blocks. Six hundred of them, recalculated daily.
Why does technical dominate? Because price action is the most data-rich signal available. A stock generates a new price point every second the market is open. Fundamental data updates quarterly. Sentiment data is noisier and harder to normalize. When you're training a model on historical patterns to predict near-term outperformance, technical data gives you the most signal per unit of time.
The implication: Danelfin is, at its core, a momentum and pattern-recognition engine. It will tend to score highly the stocks that are already moving well and showing strong price structure. That's not a flaw, momentum is one of the most durable factors in academic finance literature. But it means the model is not a value screen. A cheap stock with deteriorating price action will score low. A richly valued stock in a strong uptrend may score high.
Factor 2: Fundamental, roughly 150 daily indicators
Fundamental indicators cover the financial health of the underlying business: earnings growth, revenue trends, margins, valuation ratios, balance sheet metrics. Danelfin processes these daily, which is worth noting, most fundamental data updates quarterly, so the "daily" recalculation here is largely about normalizing and re-weighting existing data as price changes, not ingesting new earnings reports every morning.
One-sixth of the model is a meaningful contribution, but it is not the driver. If you are looking for a tool that surfaces undervalued companies with strong balance sheets and poor price action, Danelfin's fundamental layer will not rescue those names from a low technical score. The model's architecture does not work that way.
What the fundamental layer does well: it adds a quality filter on top of momentum. A stock with strong price action and deteriorating fundamentals may score lower than one with strong price action and improving fundamentals. That's a useful check. It just is not the primary signal.
Factor 3: Sentiment, roughly 150 daily indicators
Sentiment indicators capture how the market feels about a stock: analyst revisions, short interest changes, options activity, news flow, social media signals. These are the hardest to normalize and the most prone to noise, which may be part of why they share the same weight as fundamentals rather than carrying more.
Sentiment is a leading indicator when it's right and a trap when it's wrong. A stock with improving analyst revisions and falling short interest is a different setup from one with the same technical score but deteriorating sentiment. The 150 sentiment indicators give the model a way to distinguish between those two cases.
The limitation: sentiment data is inherently backward-looking in the same way technical data is. It tells you what has happened to analyst opinion and positioning, not what will happen next. A sudden earnings miss or a macro shock will blow through a positive sentiment reading instantly.
What the imbalance means
This is a momentum-weighted model wearing a fundamentals badge. That description is not an insult, momentum works, and the explainability panel at least shows you which factors are driving a given score. But if you are evaluating Danelfin as a fundamental research tool, you are reading the product wrong. Use it as a momentum-first screen with fundamental and sentiment confirmation layers. That is what it is.
Danelfin Factor Breakdown
| Factor | Approximate Daily Indicators | Share of the Model | What It Actually Measures |
|---|---|---|---|
| Technical | ~600 | ~67% | Price action, momentum, volume, volatility patterns, moving averages, breakout structures |
| Fundamental | ~150 | ~17% | Earnings growth, revenue trends, valuation ratios, margins, balance sheet metrics |
| Sentiment | ~150 | ~17% | Analyst revisions, short interest, options activity, news flow, social signals |
How Do You Use Danelfin Without Outsourcing Your Judgment?
The right way to use Danelfin is as a filter, not a signal. A 10/10 score narrows your watchlist. It does not tell you where to enter, where to put your stop loss, or how to size the position. Those decisions still belong to you.
The explainability panel
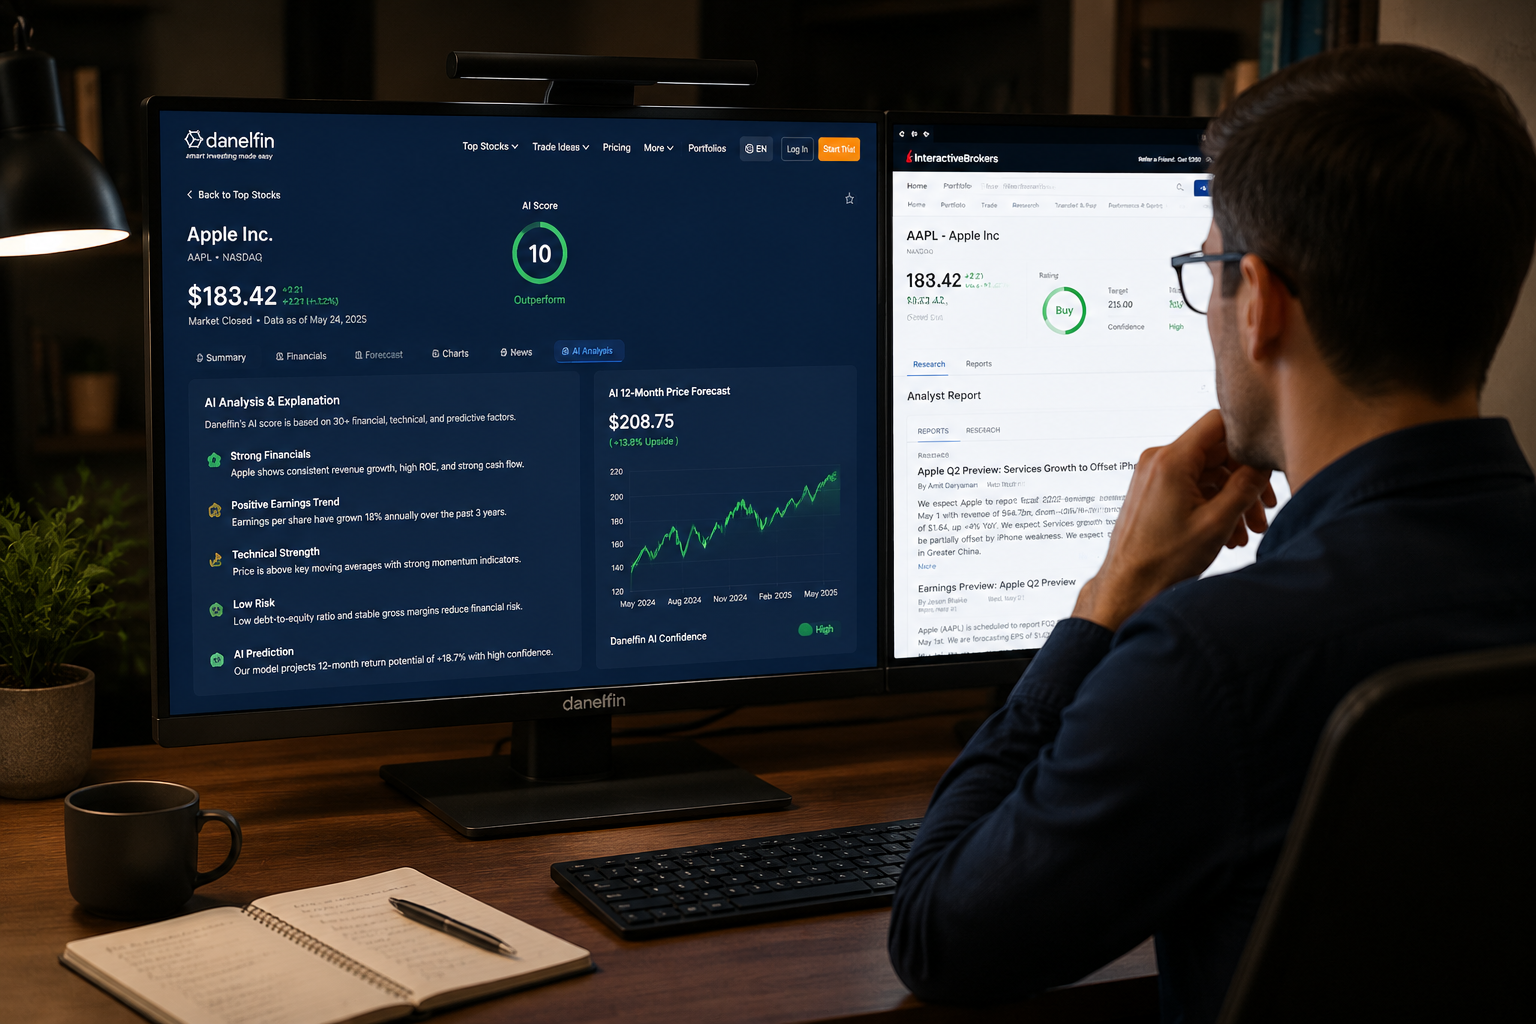
Every Danelfin score comes with an explainability panel that breaks down which factors and sub-indicators are driving the rating. If a stock scores 9/10 primarily on technical strength but shows weak sentiment, the panel will show that. That is genuinely useful information, it tells you whether the score is broad-based or riding on one factor.
The explainability panel is what separates Danelfin from a pure black-box scorer. You can look at a 10/10 and see that it's a 10 because of technical momentum, moderate fundamentals, and improving sentiment, or you can see that it's a 10 almost entirely on technical grounds with fundamentals lagging. Those are different setups and they deserve different levels of conviction.
Why a 10/10 is a starting point
A 10/10 score means the model's historical pattern recognition puts this stock in the highest probability tier for 3-month outperformance. It does not mean the stock cannot go down. It does not mean the setup is clean on your timeframe. It does not account for position sizing, your existing portfolio exposure, or a macro event that breaks the pattern.
Treat a 10/10 as the beginning of your research process, not the end of it. Check the chart yourself. Read the most recent earnings report. Look at the sector. If the Danelfin score aligns with your own read, that's a stronger case for the trade. If it doesn't, that tension is worth understanding before you commit capital. For more on building that kind of systematic pre-trade checklist, the guide on AI stock analysis tools that catch red flags before they cost you is worth reading alongside this review.
Sourced Stat Cards
900+ daily indicators per stock. Danelfin processes more than 900 daily indicators for each covered US stock and ETF, grouped into the three factor categories described above. [Source: Danelfin.com product documentation]
10,000+ daily features. The 900-plus indicators are expanded into more than 10,000 daily features through transformations and combinations before being fed into the model, trained on more than 5 billion features historically. [Source: Danelfin.com product documentation]
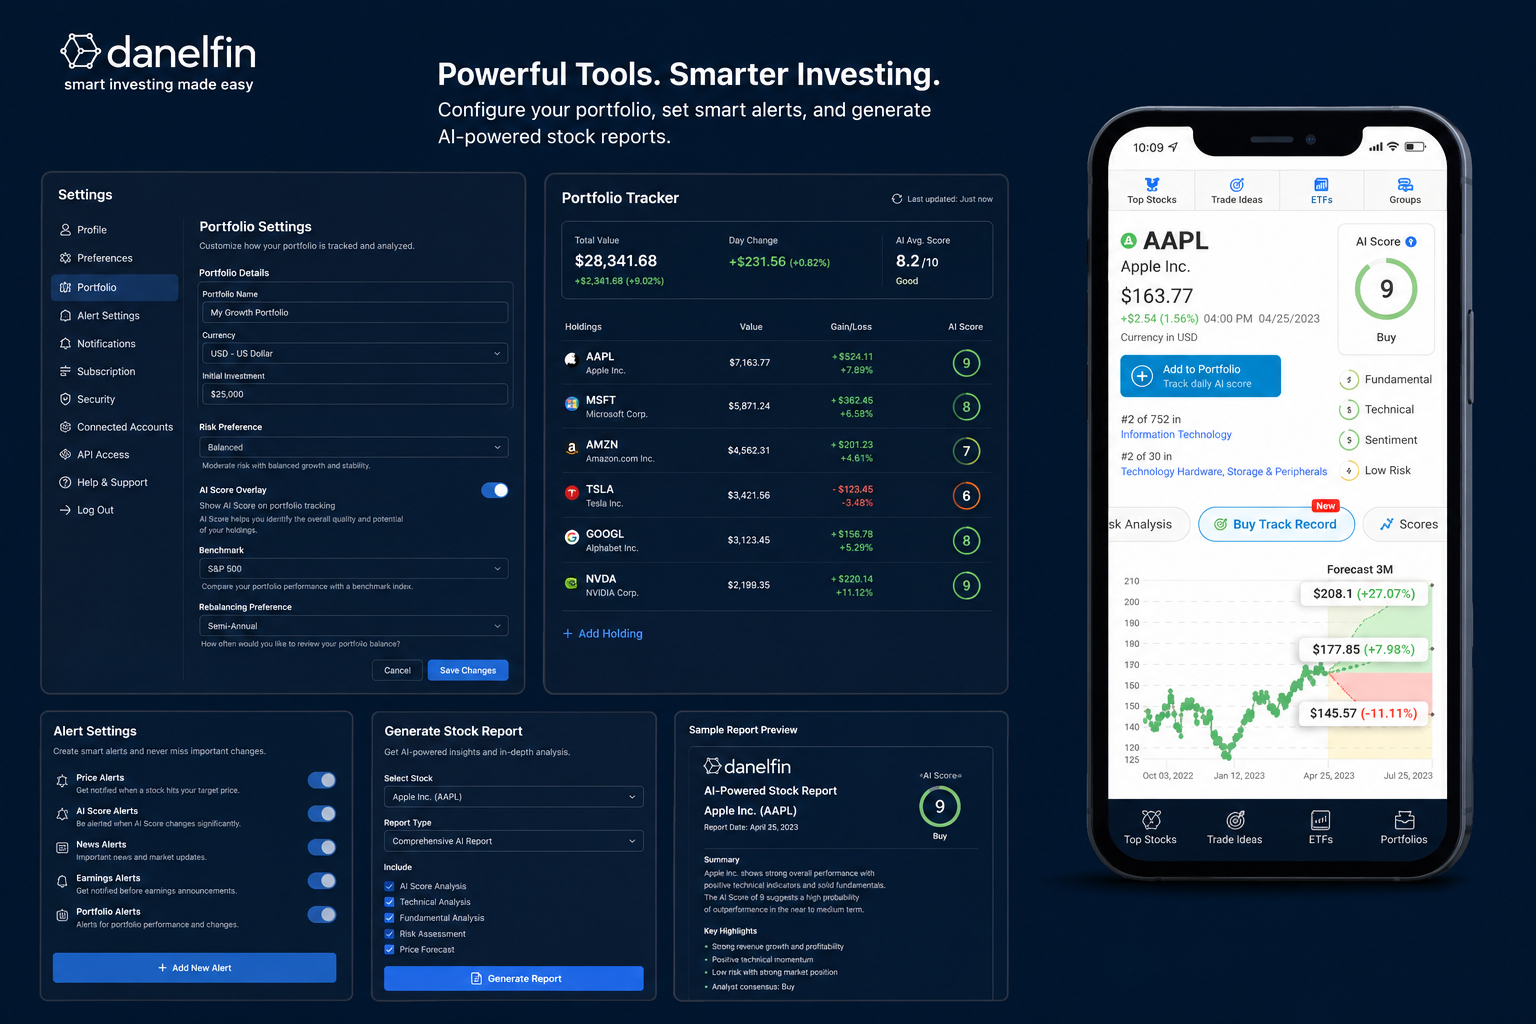
$0 free plan, no credit card. The Danelfin free plan is genuinely free, no credit card required, no trial expiration. It includes daily top-10 rankings, up to 10 monthly stock or ETF reports, and one portfolio capped at 5 holdings. [Source: Danelfin.com pricing page]
$22/month for Plus. The entry-level paid tier (Plus) costs $22 per month billed annually ($264/year), or more on a monthly basis. A 14-day free trial applies before any charge. [Source: Danelfin.com pricing page]
What Does Danelfin Cost, and Is the Free Plan Enough?
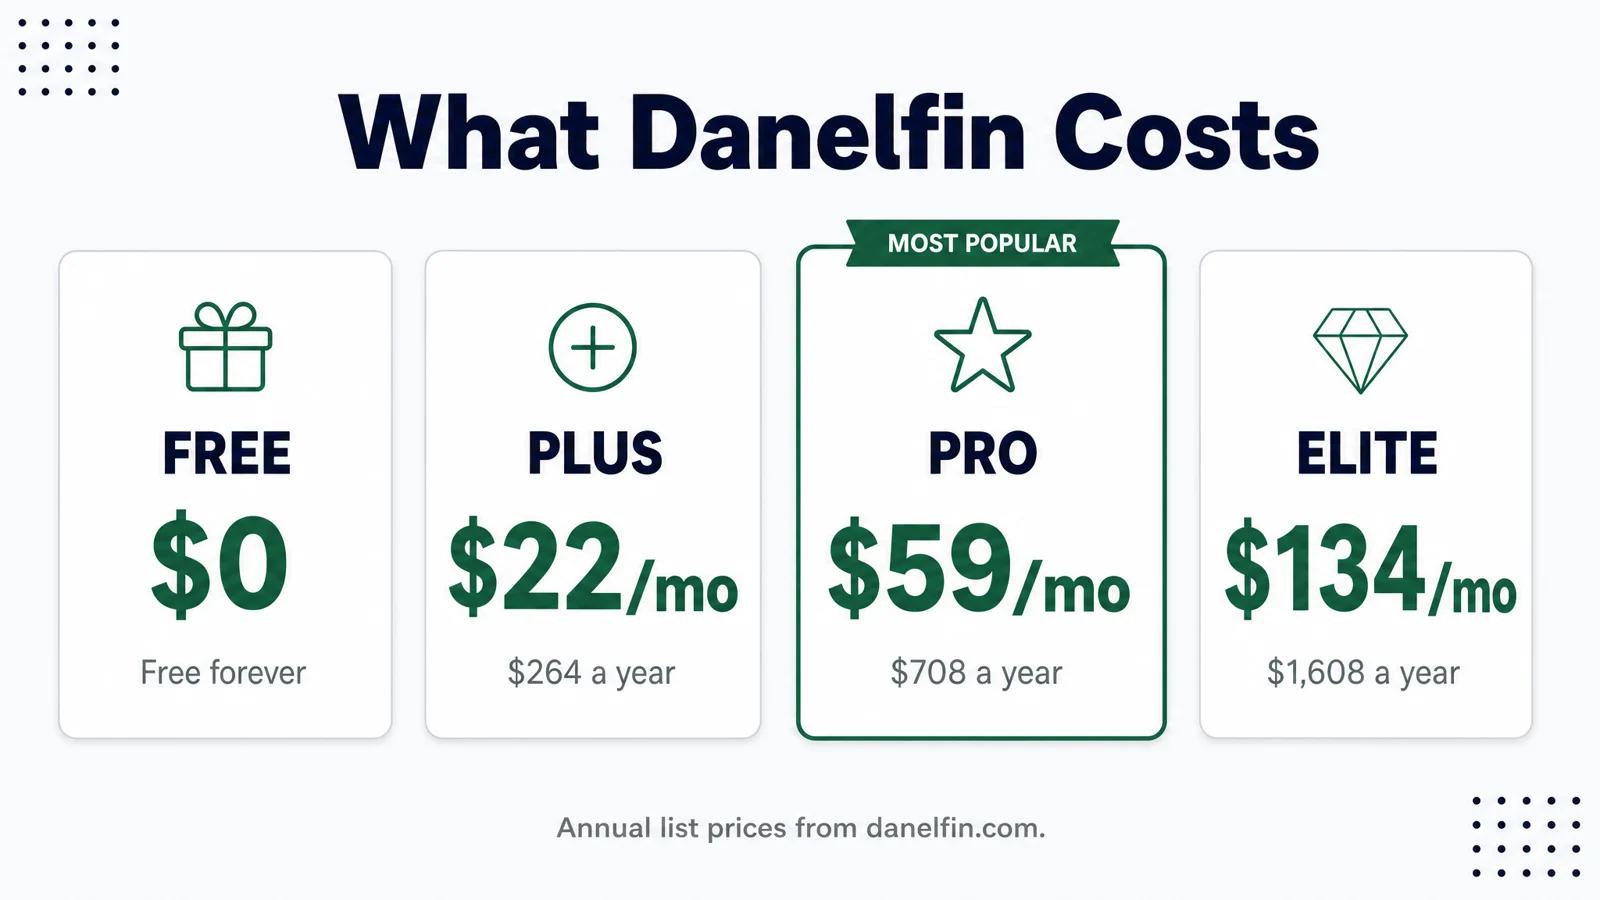
Danelfin's pricing runs from $0 to $134 per month depending on how much access you need. Here is what each tier actually includes.
Free ($0/forever, no credit card): Daily top-10 stocks newsletter, up to 10 monthly stock or ETF reports, top-10 rankings, one portfolio capped at 5 holdings, limited AI Score explainability, and the top 2 long trade ideas. This is a real free plan, not a 7-day trial with a credit card attached.
Plus ($22/month, $264/year): Wider report limits, more portfolio slots, and deeper explainability access. The 14-day free trial applies here.
Pro ($59/month, $708/year): Expanded features for more active users who need more reports, more portfolios, and full explainability depth.
Elite ($134/month, $1,608/year): Includes API Expert access alongside full web features. The most expensive tier on the website side.
All paid plans include a 14-day free trial and a 30-day money-back guarantee. A two-year billing option advertises approximately 40% savings versus monthly.
Who stays on free forever
If you want to scan the top-10 daily rankings, run occasional stock checks, and get a directional read on whether a name you're already researching has a strong or weak AI Score, the free plan covers that. Ten monthly reports is enough for a self-directed investor who is not running a high-turnover watchlist.
What forces an upgrade
Volume and depth. If you are tracking more than five holdings actively, need more than 10 reports per month, or want the full explainability breakdown on every score rather than a limited view, the free plan will hit its ceiling quickly. Plus at $22/month is a reasonable entry point for an active individual investor. Pro at $59/month makes sense for someone running a larger portfolio or doing systematic screening across many names. Elite at $134/month is a steep ask for a scoring tool that, as of this writing, carries no independent audit of its performance claims.
The Danelfin cost is honest relative to what the tool delivers on the lower tiers. The Elite price requires more conviction than the current evidence base supports for most retail investors.
Is Danelfin Legit? Reading the Performance Claims Carefully
Danelfin publishes specific performance figures. They deserve to be read carefully, not dismissed and not taken at face value.
The self-reported numbers: Stocks rated 10/10 outperformed the market by an average of +21.05% annualized alpha over a 3-month horizon. Stocks rated 1/10 underperformed by -33.28%. The Best Stocks strategy returned +376% from January 3, 2017 to June 9, 2025, against +166% for the S&P 500 over the same period.
What annualized alpha means in plain English: Alpha is the return above what the market delivered over the same period. Annualized alpha of +21.05% means that, on average, 10/10-rated stocks returned 21.05 percentage points more per year than the benchmark, not that they returned 21.05% in absolute terms. It is a measure of outperformance, not total return.
What a backtested strategy figure can and cannot tell you: The +376% figure is a backtest, it shows how the strategy would have performed if you had followed it perfectly from 2017 to 2025, with no slippage, no execution delays, and no behavioral errors. Backtests are built on the data that was available, and the model was trained on that same data. That creates look-ahead bias risk, even in well-constructed backtests. A live, forward-tested track record audited by a third party would be a stronger claim. Danelfin does not have one publicly available.
Is Danelfin legit? Two things are true simultaneously. First, Danelfin is transparent about its methodology in ways most competitors are not, publishing the factor split, the indicator count, and a clear disclaimer about what the score does and does not predict. That transparency is real and it earns credit. Second, the performance figures are self-reported and have not been audited by any independent third party. Both facts belong in the same sentence. A tool can be methodologically honest and still lack external verification. That gap is the main reason to treat the performance claims as directionally interesting rather than confirmed.
Danelfin reviews complaints are sparse because public discussion of the tool is sparse, which is its own data point, covered in the scoring section below. The complaints that do surface tend to center on the lack of independent verification and the 3-month horizon limitation, both of which are legitimate concerns.
Danelfin Alpha Score: 75/100
Signal Quality: 16/20
The signal quality is solid for what the tool claims to do. The AI Score produces a clear, ranked output that is traceable through the explainability panel. The 3-month horizon is well-defined and the probability framing is honest. The score loses points here because the self-reported performance figures, while directionally compelling, have not been tested against live forward data in a publicly verifiable way. A score built on 900-plus indicators that has been running since 2017 should have a live track record by now. The backtest is not a substitute.
Transparency: 19/20
This is the highest score on the FullStack Alpha board, and it is earned. Publishing the factor split, 600 technical, 150 fundamental, 150 sentiment, is genuinely rare in a category where "proprietary AI" is the standard non-answer. Danelfin goes further by providing an explainability panel for individual scores, stating plainly that the model calculates probabilities rather than predictions, and disclosing the indicator count and feature expansion methodology. One point is held back because the model's internal weighting within each factor group is not disclosed. You know the factor split; you do not know how the 600 technical indicators are weighted against each other. That is a reasonable limitation, not a dealbreaker, but it keeps the score from a perfect 20.
Price-to-Value: 16/20
The free plan is genuinely useful, which is a meaningful statement in a category full of tools that gate everything behind a paywall. Plus at $22/month is reasonable for an active individual investor. The score drops from higher because Elite at $134/month is a significant ask for a tool that lacks independent performance verification. The API tiers, priced separately and reaching $449/month at the top end, are appropriate for institutional or developer use cases but represent a different buyer entirely.
Usability: 15/20
The interface is clean and the 1-to-10 scale is immediately legible. The explainability panel adds depth without overwhelming a first-time user. The score sits at 15 rather than higher because the free plan's limitations, particularly the 5-holding portfolio cap and limited explainability, mean new users hit friction points before they can fully evaluate whether the tool earns an upgrade. The learning curve is low, but the value curve requires a paid plan to fully experience.
Community Verdict: 9/20
This is the lowest score on the FullStack Alpha board, and it needs to be stated plainly. Organic discussion of Danelfin is close to zero. Searches for "danelfin review reddit" and "danelfin reddit" return very little, a handful of posts, minimal comment threads, no sustained community of users sharing results or debating methodology. G2, Capterra, and Trustpilot profiles exist but carry thin review counts. There is no independent corroboration of the performance claims from real users running the tool on live portfolios.
Thin discussion does not mean the tool is bad. It means there is almost no external evidence base to draw on. A tool with 19/20 transparency and 9/20 community verdict is a tool that has been honest about what it does but has not yet built the public track record that would let a skeptical investor trust it. Both of those things are true, and neither softens the other.
Who Should Use Danelfin, and Who Should Skip It?
The investor the 3-month horizon genuinely serves
A self-directed investor managing a portfolio of individual US stocks on a one-to-six-month horizon is the right fit. Someone who wants a systematic, data-driven second opinion before committing capital, not a replacement for their own research, but a filter that narrows the field and flags names worth looking at more closely. If you are already doing fundamental research and want a momentum and sentiment overlay to time entries better, Danelfin fits that workflow. The AI tools swing traders are using to catch moves before everyone else piece covers the broader category context for this type of tool.
The day trader and the buy-and-hold investor
Both are outside the window. A day trader needs intraday signals, not a 3-month probability score. A buy-and-hold investor with a five-year view on a business does not need to know whether the stock is likely to beat the market over the next quarter, that information is noise relative to their actual decision. Using a 3-month momentum tool to make decade-long investment decisions is catching a falling knife with the wrong instrument.
The reader who should stay on the free plan indefinitely
If you are checking in on a handful of stocks occasionally, want the daily top-10 as a watchlist starting point, and run fewer than 10 research reports per month, the free plan covers your use case completely. There is no reason to upgrade until the free plan's limits are genuinely constraining your process.
The Verdict on the 3 Factors
Three factors sit behind every Danelfin AI Score: technical, fundamental, and sentiment. Technical carries the model, accounting for roughly 600 of the 900-plus daily indicators and approximately two-thirds of the model's weight. Fundamental and sentiment each contribute roughly 150 indicators and one-sixth of the model's influence. That makes Danelfin a momentum-first tool with fundamental and sentiment confirmation layers, useful, honest about its method, and meaningfully differentiated from black-box competitors by its published factor split. What would improve this verdict: an independent audit of the performance claims and a growing base of real users discussing live results publicly. Right now, Danelfin has the transparency to earn trust and the verification gap to limit it. Both are true, and a smart investor should hold both before acting on the score.
Final Verdict
Danelfin earns its 75/100 Alpha Score on the strength of one genuinely rare quality: it tells you what is inside the box. The 600/150/150 factor split, the explainability panel, and the honest probability framing put it ahead of most competitors on transparency. The AI Score is a clean, usable output for self-directed investors on a 1-to-6-month horizon, and the free plan is real enough that casual users never need to pay. The gap between the score and a higher rating comes down to two things: the performance claims are self-reported and unaudited, and almost nobody is talking about this tool publicly. A momentum-weighted model with honest disclosure and no independent verification is a starting point, not a destination. Use it as a filter, do your own research on every name it surfaces, and do not let a 10/10 replace the work of understanding what you are buying.
One tool, scored five ways. There are 200+ more in the FullStack Alpha directory, filterable by category, price, and what they actually do. Browse the full AI stock tool directory at aistockpickerapps.com.
Affiliate disclosure: This review contains affiliate links. If you purchase through them, FullStack Alpha may earn a commission at no additional cost to you. Scores and editorial opinions are independent of affiliate relationships.
We test the tools. You get the verdict.
One email a week. What we tested, what scored, and what we'd skip. Written for traders, not for clicks.
Frequently asked
Topics in this teardown
Our verdict on Danelfin
Danelfin scores 75, and the two pillars behind it point in opposite directions.