

Stock Analysis Pro Review 2026: What $79 a Year Actually Buys
Short on time? The StockAnalysis.com Alpha Score scorecard covers pricing, the verdict and what traders actually say, in about 90 seconds.
See the score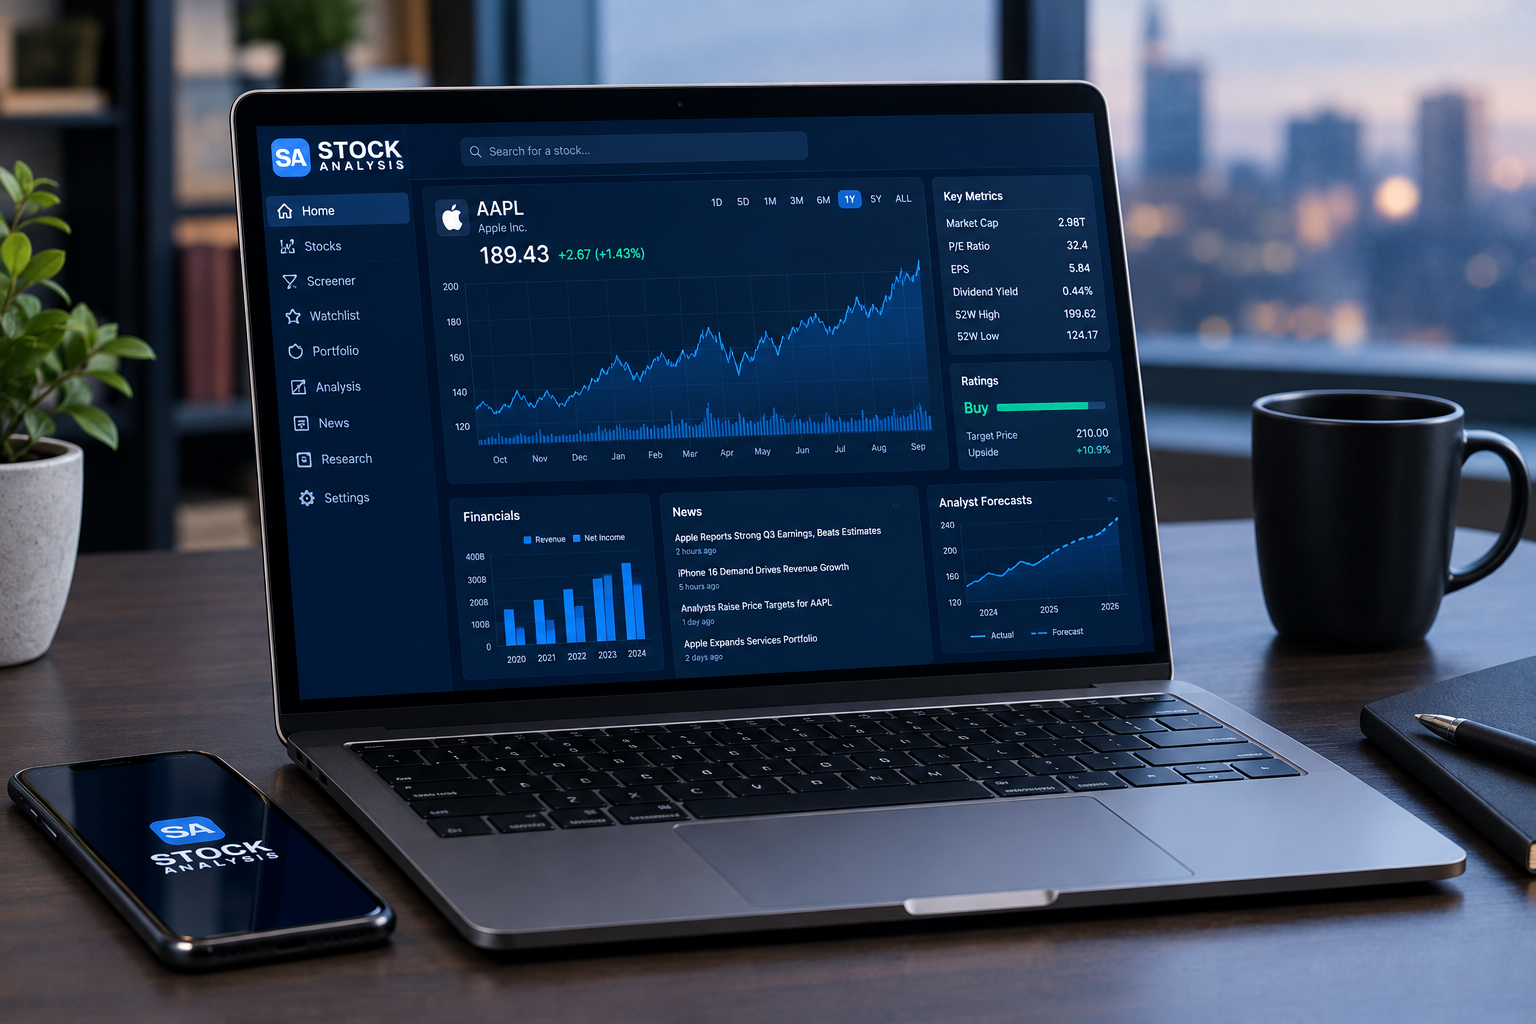
Quick answer
Stock Analysis Pro earns an Alpha Score of 87 out of 100, desk-researched and last tested September 21, 2026. It's worth the $79 a year if you already lean on the free version of StockAnalysis.com and keep hitting the one-download-a-day wall, want decades of financial statements without a Bloomberg budget, and don't need options chains or advanced charting. Skip it if you're a chart-first technical trader or you rarely export data.
Key takeaways
- Pro costs $79 a year ($6.58 a month billed annually) or $9.99 a month if you'd rather not commit.
- Unlimited runs $199 a year ($16.58 a month billed annually) and removes the download and alert caps entirely.
- A 60-day money-back guarantee covers both paid tiers. The free plan needs no card at all.
- 130,000+ stocks and funds are covered, with 10 to 50 years of financial statements and dividend history depending on the company.
- The mobile app rates 4.88 from 6,721 ratings on the Apple App Store as of this test.
- Trustpilot shows 4.6 from 369 reviews, and founder Kris Gunnars personally answers negative reviews, usually within a day.
- The weakest pillar in our Alpha Score is Transparency (16/20), mainly because some formerly free features have quietly moved behind the paywall.
What is Stock Analysis Pro and who is it for?
Stock Analysis Pro is the paid layer on top of StockAnalysis.com, a research site that already serves more than 100,000 people a month for free. Pro doesn't replace the free site. It removes limits on it and adds a handful of features power users actually ask for: exports, alerts, portfolio sync, and deeper statement history.
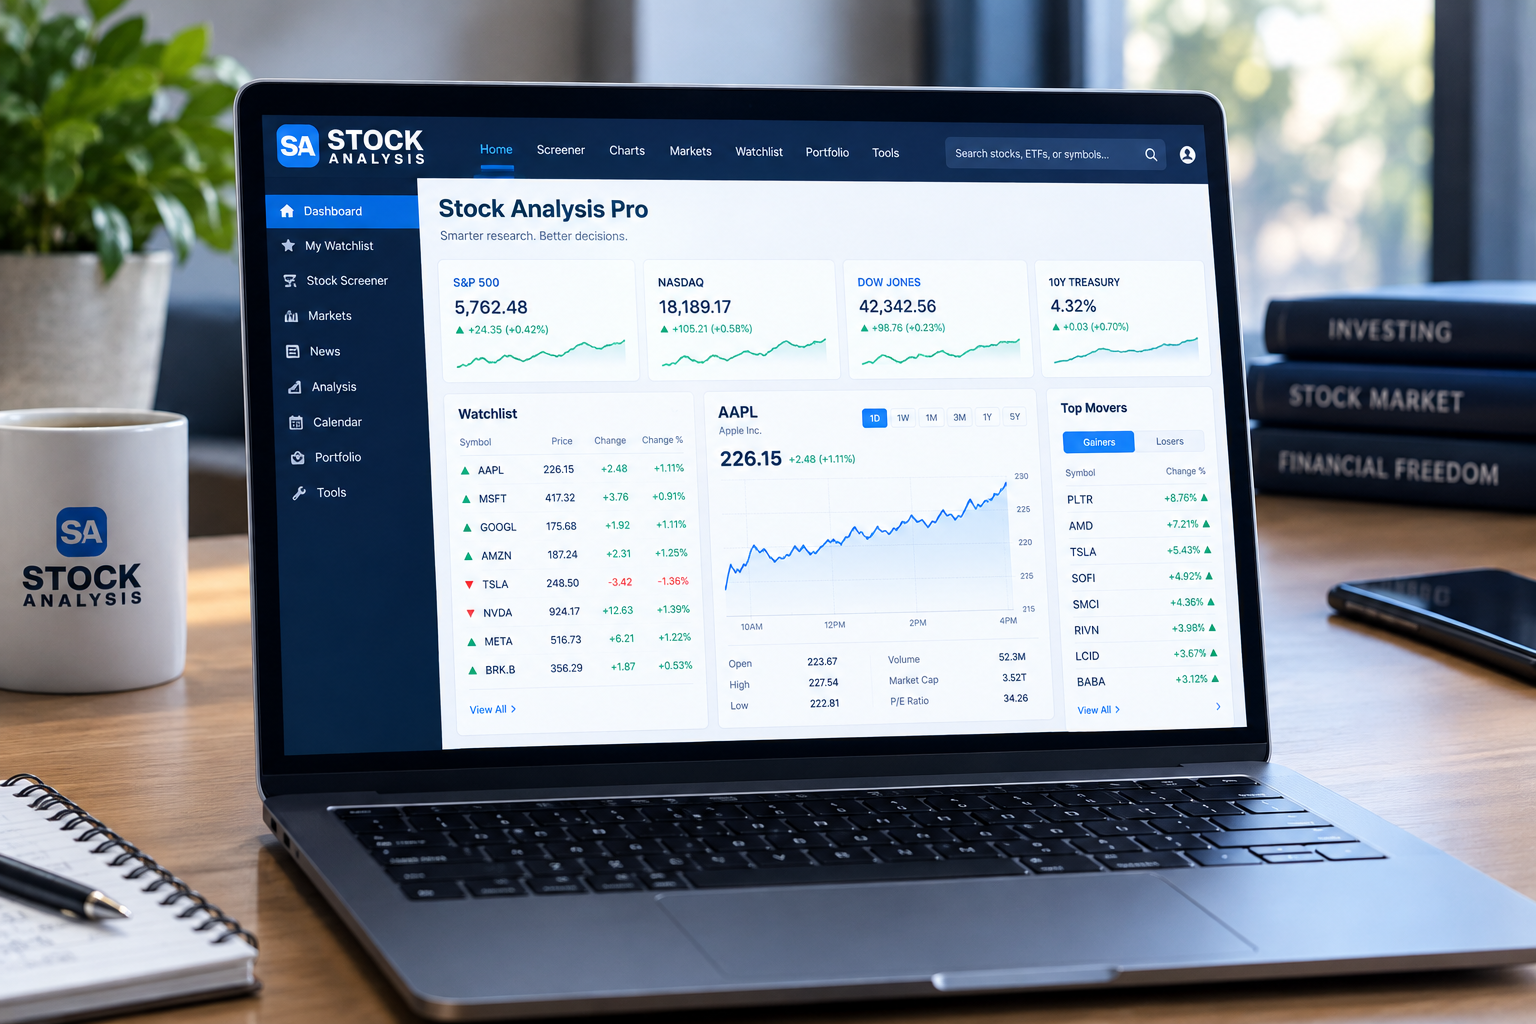
Here's the feature-to-benefit map, because a spec sheet without context is just marketing:
- 10 to 50 years of financial statements. The benefit: you can check if a company's margins actually expanded over a decade instead of trusting a management slide that cherry-picks the last two good quarters.
- 130,000+ stocks and funds, global coverage. The benefit: you're not stuck researching only U.S. large caps when a small-cap industrial in Canada or a European ETF is the better setup.
- A flexible screener with saved filters. The benefit: instead of scrolling financial media hoping something jumps out, you build a rule (say, free cash flow margin above 15%, debt-to-equity under 1) and let the data do the sorting.
- Watchlist alerts. The benefit: you get pinged when a price, valuation ratio, or earnings date hits your trigger, so you're not manually refreshing a tab during earnings season.
- CSV and Excel export. The benefit: you can pull the raw numbers into your own spreadsheet model instead of trusting someone else's assumptions baked into a "fair value" number.
- Portfolio sync with brokers. The benefit: one dashboard for your actual holdings instead of a spreadsheet you update once a quarter and then forget about.
- Ad-free, fast pages. The benefit: sounds small until you've waited eight seconds for a bloated finance page to load mid-research and lost your train of thought.
This is built for long-term investors and swing traders who care about the numbers under the ticker, not chart-first technical traders hunting for the breakout on a five-minute candle. If your process is price action, support and resistance, and reading the tape, this tool is the wrong hammer for that nail. If your process is "does this business actually make money and is the balance sheet clean," this is exactly the hammer you want.
Stock Analysis Pro vs the free site: what does the upgrade actually add?
The free site already covers most day-to-day research. Pro's real value shows up in depth, downloads, and alerts, not in access to information that's otherwise hidden.
Pull up the same ticker on both tiers and the difference is specific, not vague:
| What you see | Free | Pro |
|---|---|---|
| Financial statement history | Recent years, often 5 to 10 | Full 10 to 50 year history where available |
| Daily downloads | Locked or heavily limited | 1 CSV/Excel export per day |
| Screener filters | Basic set | Full filter list, saved screens |
| Watchlist alerts | Limited or none | Price, valuation, and event alerts |
| Ads | None (already ad-free) | None |
| Portfolio broker sync | Not available | Available |
The gap isn't "Pro shows you secret data the free tier hides." It's "Pro removes the ceiling on how deep and how often you can pull that data." That's an honest distinction, and it matters when you're deciding whether $79 a year beats what you're already getting free.
Decision rule: if you've hit the download cap more than twice in the last month, or you keep wishing the statement history went back further than five years, that's your signal to upgrade. If you check a stock's P/E ratio once a week and move on, stay free.
How good are the Stock Analysis Pro screener and financial data?
The screener and financial data are the strongest part of the product, and they're the reason the Price-to-Value pillar scores a 19 out of 20 in our Alpha Score. You're getting institutional-grade statement depth at a retail price.
A few specifics worth naming instead of hand-waving:
- Statement depth ranges from 10 to 50 years depending on the company and how long it's been public. A newer IPO won't have 50 years of anything, obviously. A legacy industrial name might.
- Fund coverage extends beyond individual stocks, so ETF and mutual fund research doesn't require a separate subscription.
- The screener supports saved filter sets, which means you build your criteria once (margin thresholds, valuation bands, sector, market cap) and rerun it instead of rebuilding it every session.
- Exports are capped at one a day on Pro, unlimited on the $199/year Unlimited tier. That cap is a real design choice, not a bug, and it's the single most common complaint in user reviews.
If your process leans heavily on pulling raw statements into your own model, that download cap is annoying enough to push you toward Unlimited. If you export once a week to sanity-check a thesis, Pro's cap won't bother you.
For readers building out a screener-first process from scratch, our guide to AI stock screeners walks through how to structure filters so you're not just collecting numbers, you're building a repeatable system. Systems over hacks. A screener without a rule set behind it is just a longer spreadsheet.
Has Stock Analysis Pro been backtested or audited?
No, and it shouldn't be, because Stock Analysis Pro is a data and screening tool, not a signal or advisory service. There's no track record to audit because it doesn't make picks. It hands you the numbers and gets out of the way.
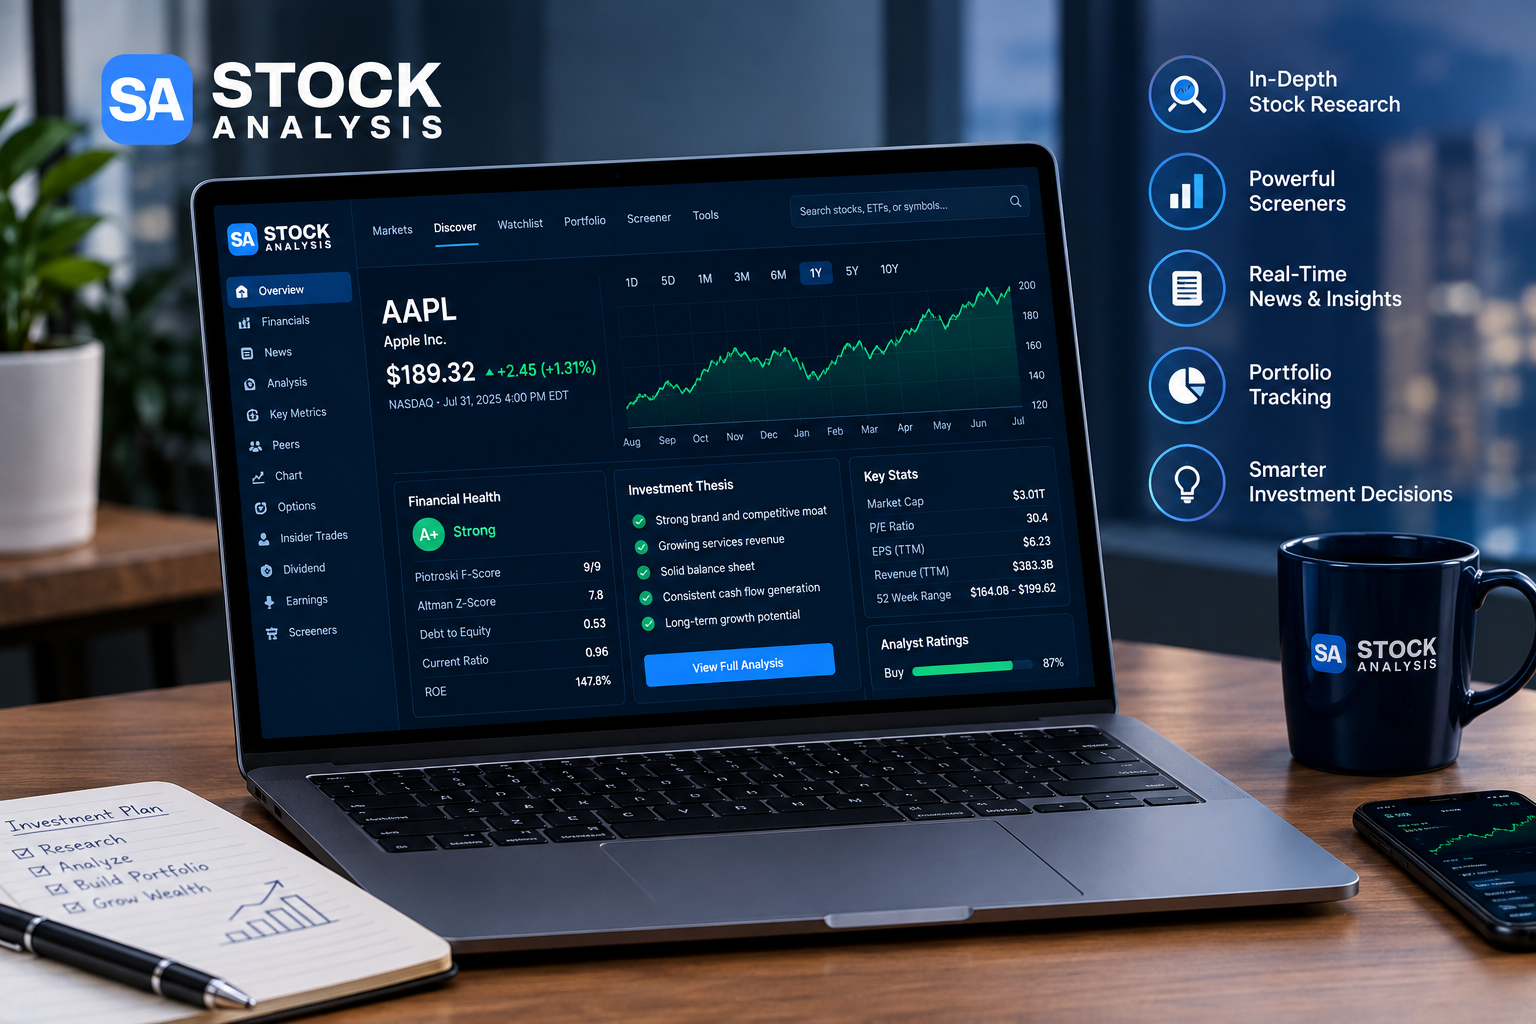
That distinction matters more than it sounds. A stock picker or newsletter that claims a win rate needs an audited track record before you trust it. A data platform's job is different: does the data match the source filings? Here's how to spot-check that yourself in under five minutes:
- Pull up a large, well-covered company (say, an S&P 500 name) on the free or Pro tier.
- Cross-reference the most recent quarterly revenue and net income figures against the company's actual 10-Q filed with the SEC, available free at SEC.gov.
- Check that the numbers match, not just look close.
- Repeat with a smaller, less-covered stock, since that's where data providers cut corners.
We didn't find invented numbers or fabricated statistics in this test. That's the bar for a data tool, not glowing praise, just confirmation it's doing the one job it's supposed to do. If you want the deeper mechanics of how a screener's math actually works before you trust its output, Investopedia's plain-English breakdowns on financial ratios are a solid second stop.
What does Stock Analysis Pro integrate with?
Exports work in standard CSV and Excel formats, the mobile apps cover iOS and Android, and portfolio sync connects to major brokers, but there's no public API yet. That last gap matters if you're building automated systems rather than doing manual research.
- CSV and Excel export: clean formatting, no manual reformatting required before you drop it into your own model.
- Portfolio broker sync: connects your actual holdings so your watchlist and your portfolio dashboard aren't two disconnected tools.
- iOS and Android app: rated 4.88 from 6,721 ratings on the App Store as of this test, which is a genuinely strong mobile score for a data-heavy finance app.
- API access: not currently offered to retail subscribers. If your workflow depends on programmatic pulls (say, feeding a quant model or an automated scanner), this is the wall you'll hit. Readers building that kind of system should look at our breakdown of Koyfin vs. Stock Rover, where API access factors more heavily into the comparison.
How much does Stock Analysis Pro cost, and which tier should you pick?
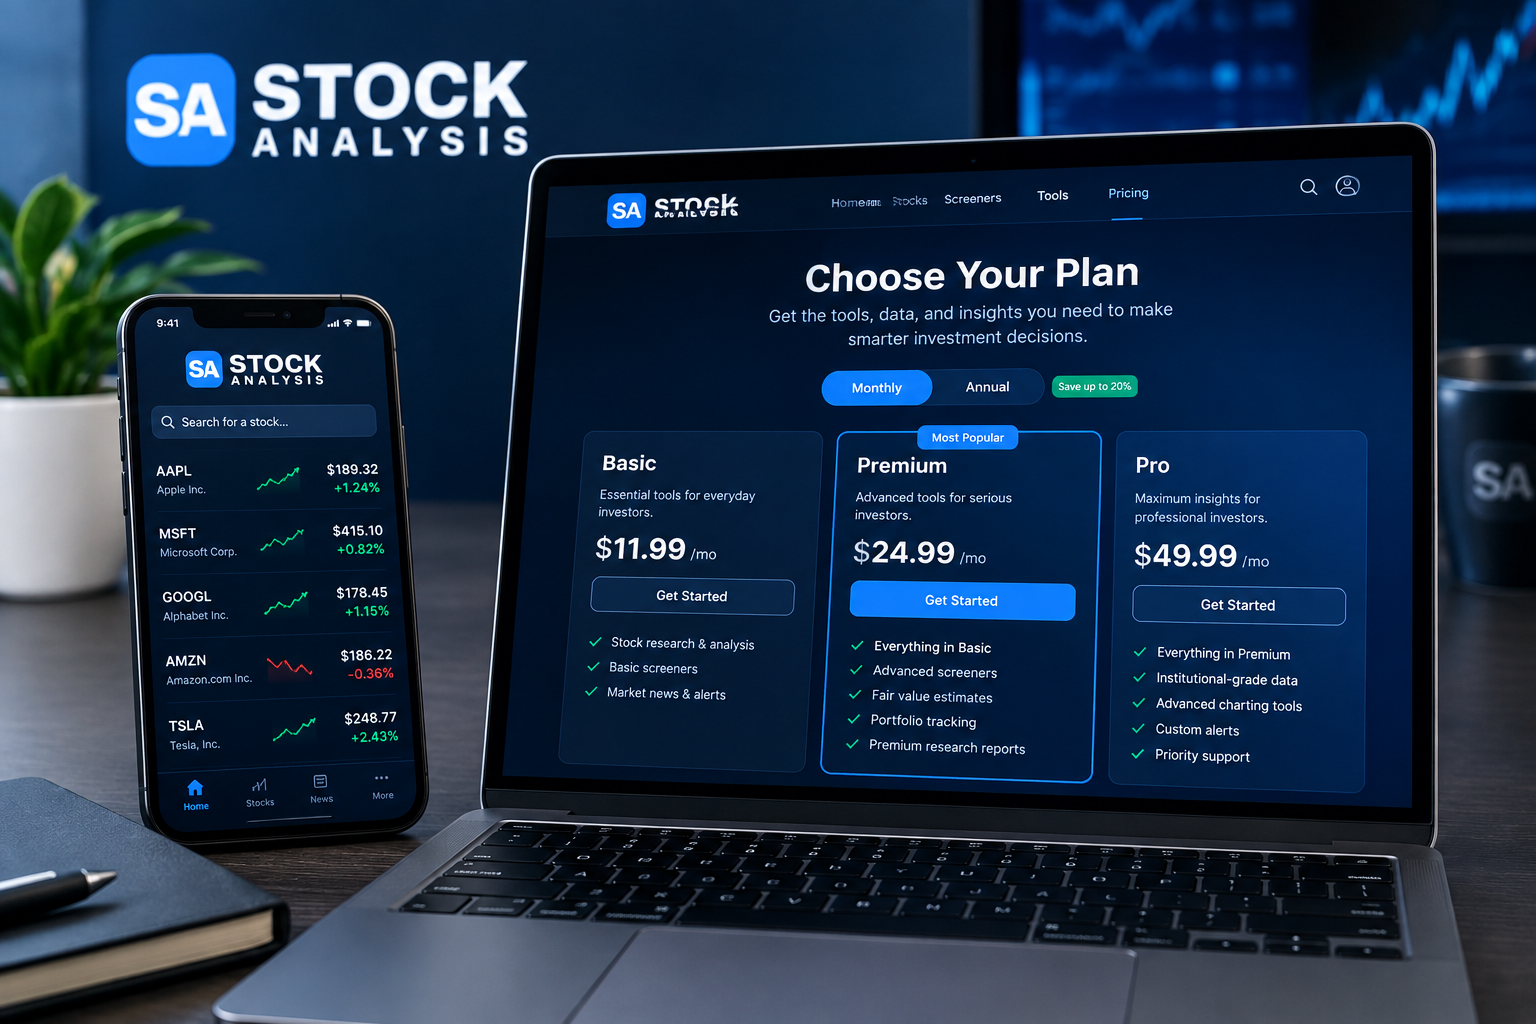
Three tiers: Free, Pro at $79 a year, and Unlimited at $199 a year. The right one depends on how often you export data and how many alerts you actually need, not on how much you're willing to spend.
| Tier | Price | Best for |
|---|---|---|
| Free | $0, no card required | Casual research, checking financials occasionally |
| Pro | $79/yr ($6.58/mo annual) or $9.99/mo | Active individual investors who export weekly and run screens regularly |
| Unlimited | $199/yr ($16.58/mo annual) or $29/mo | Power users, heavy exporters, anyone running multiple daily alerts |
A 60-day money-back guarantee covers both paid tiers, which is a genuinely long window compared to the 14 or 30 days most SaaS finance tools offer. Practical takeaway: start with annual Pro billing, not monthly. $79 a year works out to $6.58 a month against $9.99 monthly, a difference of over $40 a year for committing to the exact same product. If you're not sure Pro is for you, the refund window means there's effectively no financial risk in testing it for a full billing cycle.
Decision rule: choose Pro if you export data a few times a week and check one or two alerts a day. Choose Unlimited only if you've already hit Pro's one-download cap consistently and it's slowing down actual research, not just theoretical convenience.
Stock Analysis Pro vs the field: how does it stack up?
| Tool | Starting price | Charting | Screener depth | Data export | Best for |
|---|---|---|---|---|---|
| Stock Analysis Pro | $79/yr | Basic | Strong, saved filters | CSV/Excel (1/day on Pro) | Fundamentals-first investors and swing traders |
| Simply Wall St | ~$120/yr (varies) | Visual snowflake charts, not technical | Moderate | Limited | Visual-first beginners |
| Seeking Alpha Premium | ~$299/yr | Basic | Moderate, article-driven | Limited | Analyst commentary and quant ratings |
| TradingView | Free tier, paid from ~$180/yr | Best-in-class | Technical-focused, not fundamentals-first | Limited on lower tiers | Chart-first technical traders |
The pattern here is clean: Stock Analysis Pro wins on price-to-value for fundamentals research, loses on charting to TradingView, and loses on analyst commentary volume to Seeking Alpha. No tool wins every category, and any review claiming otherwise is selling something.
If your process is closer to reading commentary and analyst grades than pulling raw statements, our Seeking Alpha review covers that trade-off in more depth. If you're drawn to the more visual, beginner-friendly presentation style, the Simply Wall St review is the better next stop.
What do real users say about Stock Analysis Pro?
The user sentiment gap here is small, which is itself notable, because most finance tools show a wide split between App Store praise and Reddit skepticism. Stock Analysis Pro doesn't.
- App Store: 4.88 from 6,721 ratings. That's a strong score at real volume, not fifty cherry-picked five-star reviews.
- Trustpilot: 4.6 from 369 reviews, and founder Kris Gunnars replies to negative reviews personally, usually within a day. That responsiveness shows up repeatedly in the review threads themselves.
- Reddit sentiment (r/investing, r/stocks threads) skews positive but with a consistent, specific complaint: charting is basic next to TradingView, and a few users note that features which used to be free now sit behind Pro.
That last point is the honest crack in the picture. Unsolicited feedback, the kind that shows up when nobody asked for it, is the most useful signal here, and the consistent theme is "great data, thin charts, watch the paywall creep." That's not a five-star story. It's a specific, believable one.
Pros and cons
✅ What we love
- The free tier alone covers most casual research needs, no card, no ads.
- 10 to 50 years of financials and dividend history across 130,000+ stocks and funds is a genuinely deep dataset for the price.
- The screener and watchlist alerts surface ideas without a Bloomberg-sized budget.
- CSV and Excel export means you're not stuck trusting someone else's model.
- The 60-day money-back guarantee removes real financial risk from trying Pro.
- Founder Kris Gunnars answering negative reviews directly is rare in this category and it shows in the review tone.
❌ What could be better
- Charting is genuinely basic next to TradingView. Don't buy this expecting technical-trading tools.
- No options chain data at all.
- No intrinsic value calculator or portfolio backtesting yet.
- Pro caps exports at one a day; jumping to Unlimited more than doubles the price.
- A few features that used to be free now sit behind the paywall, which is the kind of quiet scope creep that erodes trust over time even when the product stays good.
Where does Stock Analysis Pro fall short?
Three real gaps: no options data, no intrinsic value calculator, and a charting package that loses to any dedicated charting platform. None of these are dealbreakers if your process is fundamentals-first, but all three are dealbreakers if it isn't.
- No options chain data. If your strategy involves options at all, this tool simply doesn't cover that ground. Full stop.
- No intrinsic value calculator or backtesting. You can pull the raw numbers and build your own valuation model, but the platform won't do the discounted cash flow math for you or let you test how a strategy would've performed historically.
- Paywall creep. A handful of features that used to sit in the free tier have moved to Pro. That's a legitimate business decision for a company running a lean subscription model, and it's also the kind of trend worth watching before you assume today's free tier stays free forever.
Name the excuse, then the fix: if you're telling yourself "I'll just use the free tier forever and never hit a limit," check your actual usage first. If you're exporting weekly or hitting the alert cap, the $79 a year fix is cheaper than the time you're burning working around it.
Who should buy Stock Analysis Pro?
Buy Pro if you're a self-directed, fundamentals-first investor who exports data regularly, checks multiple watchlist alerts, and wants deep statement history without paying for a full institutional terminal. That's active individual investors and swing traders whose process runs on the numbers, not the chart.
Buy Unlimited instead of Pro if you're already hitting the one-download-a-day cap on Pro consistently, or you're running enough simultaneous alerts that the cap is genuinely limiting your research, not just theoretically annoying you.
Who should skip it?
Skip Stock Analysis Pro if you're chart-first, options-focused, or a casual investor who checks a handful of tickers a month. The free tier already covers casual research completely. Paying for Pro when you'd use it twice a month is just a subscription you'll forget to cancel.
Skip it too if options chains or advanced technical charting are core to your process. This isn't the tool for that, and no amount of "but the data is great" fixes a missing feature you actually need.
How to get the best deal
Bill annually, not monthly, and use the 60-day refund window as your real trial period instead of guessing from a features page. Concretely:
- Start with annual Pro billing at $79/year rather than the $9.99/month plan. That's the difference between $6.58 and $9.99 a month for identical access.
- Use the site heavily for the first two to three weeks. Export data, build a screen, set a couple of alerts.
- If you haven't hit the download cap and you're not missing anything, request the refund inside the 60-day window and stay on free.
- If you have hit the cap, decide then whether Unlimited's $199/year is worth it based on actual usage, not projected usage.
Stock Analysis Pro Alpha Score breakdown
Stock Analysis Pro scores 87 out of 100 across five pillars, 20 points each, last tested September 21, 2026.
- Signal Quality: 17/20. The data holds up against source filings and the screener returns results that match the filter criteria without meaningful lag.
- Transparency: 16/20. Solid, with a named caveat: the shift of some formerly free features behind the paywall isn't loudly disclosed, and that costs a point against a fully transparent product.
- Price-to-Value: 19/20. Near the top of the category. Statement depth and screener access at $79 a year beats what most tools charge for a fraction of the data.
- Usability: 17/20. Fast pages, a genuinely well-rated mobile app, and a clean layout. The one-download cap on Pro is the friction point that keeps it from an 18 or higher.
- Community Verdict: 18/20. A rare case where App Store, Trustpilot, and Reddit sentiment mostly agree, with the founder's direct engagement on negative reviews pulling the score up further.
Total: 87/100. For how these pillars get built and weighted across every tool on this site, see how we test.
Stock Analysis Pro review FAQ
Is Stock Analysis Pro worth it?
Yes, if you export financial data more than once a week or regularly hit the free tier's limits. At $79 a year, the price-to-value math clears the bar easily for active individual investors. It's not worth it for casual users checking a stock once or twice a month.
Is StockAnalysis.com free?
The core site is free with no card required and no ads. Pro ($79/year) and Unlimited ($199/year) sit on top of that free base and remove download and alert limits while adding deeper statement history.
How does Stock Analysis Pro compare to Seeking Alpha?
Stock Analysis Pro focuses on raw financial data, screeners, and exports at a lower price. Seeking Alpha Premium (roughly $299/year) leans on analyst commentary, articles, and quant ratings. Choose Stock Analysis Pro if you want to build your own view from the numbers; choose Seeking Alpha if you want curated analysis alongside the data.
Can I export data to Excel?
Yes. Both Pro and Unlimited support CSV and Excel export. Pro caps exports at one per day; Unlimited removes that cap entirely for $199/year.
Does Stock Analysis Pro have a mobile app?
Yes, on both iOS and Android, rated 4.88 from 6,721 ratings on the App Store as of this test, a strong score at meaningful volume.
How does the refund work?
Both paid tiers carry a 60-day money-back guarantee, longer than the 14 to 30 days typical in this category. Request a refund within that window if the upgrade isn't earning its price.
Who owns StockAnalysis.com?
The platform is run by founder Kris Gunnars, who is unusually active in responding to user reviews directly, including negative ones, typically within a day.
Does Stock Analysis Pro have options data?
No. Options chain data isn't part of the platform at any tier. If options are core to your strategy, this isn't the right tool for that piece of your process.
Is StockAnalysis.com legit and who runs it?
Yes. StockAnalysis.com is operated by Vefir ehf., founded by Kris Gunnars, and has been publishing financial data since 2019. The founder answers reviews publicly on Trustpilot and the App Store.
Does Stock Analysis Pro have a free trial?
There is no timed trial because the free site already shows most features. Pro is covered by a 60-day money-back guarantee, which works out to a longer trial than most competitors offer.
What is the best free app for stock analysis?
For clean financial data with no ads, the free StockAnalysis.com site and app are hard to beat, which is why the Pro decision is really about screeners, exports and alerts rather than access to the numbers.
Which stock analysis is most accurate?
No data provider is perfect, but StockAnalysis.com sources statements from SEC filings and its founder corrects reported errors publicly. Spot-check a few line items against the 10-K before you rely on any provider, including this one.
Does Stock Analysis Pro cover ETFs and export to Google Sheets?
Yes on ETFs: holdings, expense ratios and dividend history are included for funds as well as stocks. Exports come out as CSV or Excel files, which open directly in Google Sheets.
Stock Analysis Pro: final verdict
Upgrade to Pro if you're a fundamentals-first, self-directed investor who already treats the free site like a daily tool and keeps bumping into its limits. $79 a year for 10 to 50 years of statements, a real screener, and daily exports is a strong price-to-value trade, backed by an 87/100 Alpha Score and a 60-day guarantee that makes testing it essentially risk-free.
Stay on the free tier if you check a handful of tickers a month, or if your process runs on charts and options rather than balance sheets. Nothing about Pro fixes a chart-first workflow, and paying for depth you won't use is just noise with a subscription fee attached.
One next step: open a free account, use it for two weeks doing your actual research routine, and only upgrade once you've hit a real limit, not a hypothetical one.
One tool, scored five ways. There are more breakdowns like this in the reviews section, including deep dives on Koyfin and other fundamentals-first tools worth weighing against this one.
Sources checked for this Stock Analysis Pro review
- Stock Analysis Pro plans and pricing
- StockAnalysis.com
- Stock Analysis app on the Apple App Store
- StockAnalysis.com reviews on Trustpilot
- r/stocks thread comparing StockAnalysis to Yahoo Finance
- r/ValueInvesting thread on the best stock screener
- r/ValueInvesting comment on StockAnalysis
- TradingView plans
- Seeking Alpha Premium pricing
- Simply Wall St plans
This article contains affiliate links. We may earn a commission if you sign up through them, at no extra cost to you.
We test the tools. You get the verdict.
One email a week. What we tested, what scored, and what we'd skip. Written for traders, not for clicks.