

TipRanks Smart Score: Eight Signals, One Number, No Promises
Short on time? The TipRanks Alpha Score scorecard breaks the 78/100 down by pillar, with pricing and the verdict, in about 90 seconds.
See the score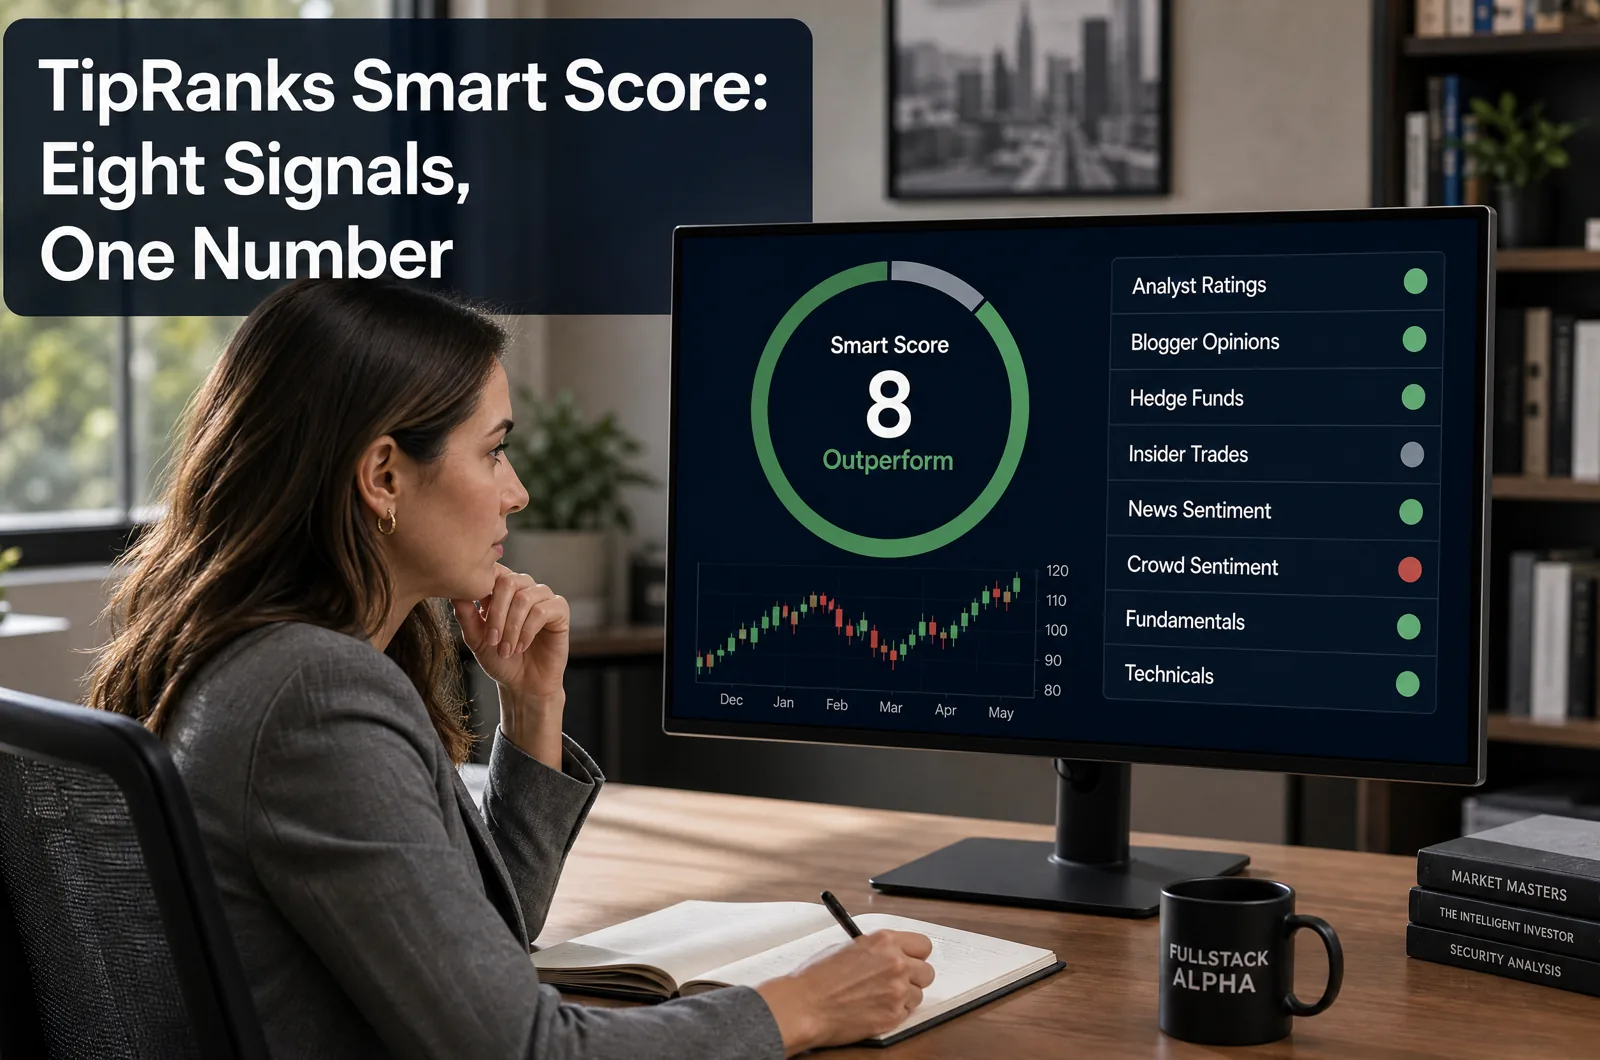
The TipRanks Smart Score compresses eight signals into one number, and it earns a 78 out of 100 on the FullStack Alpha scale: worth paying for if you want fast sentiment checks and idea generation, not worth paying for if you want it to make decisions for you.
Quick Answer
The tipranks smart score is a 1 to 10 rating built from eight data inputs (analyst ratings, blogger opinions, hedge fund activity, insider transactions, news sentiment, crowd sentiment, fundamentals and technicals). Analyst consensus is visible on TipRanks stock pages even without an account. TipRanks' paid plans start at $359 a year (Premium) or $599 a year (Ultimate) for deeper screening and portfolio tools, with a 30-day refund window on web purchases. It's a sentiment aggregator, not a forecasting model, and it should never be the only input in a buy or sell decision.
Key Takeaways
- The tipranks smart score rates stocks 1 to 10 by blending eight named inputs into one composite reading, with no human editor adjusting the final number.
- Top features: the Smart Score, analyst rankings by success rate and average return, a 16-market screener, Strong Buy and Perfect 10 lists, and Smart Portfolio tools on Premium.
- Scores of 8 to 10 are labeled Outperform, 4 to 7 Neutral, and 1 to 3 Underperform. TipRanks publishes the eight factors but keeps the weighting formula private.
- TipRanks' own backtest shows Smart Score 10 stocks returning 451.5% since January 2016 (US stocks only). That's a vendor-published, unaudited, pre-fee number, not a promise about your results.
- Analyst consensus is visible for free, even logged out. You don't need a card on file to get real value.
- List price is $359 a year for Premium and $599 a year for Ultimate, billed yearly on the website. A 55% intro coupon can cut that sharply, but promo codes change size and expire.
- Web purchases carry a 30-day money-back guarantee, usable once per product per 12 months. It doesn't cover app-store purchases or monthly billing.
- This tool fits self-directed investors who want a fast sentiment check across thousands of names. It doesn't fit anyone hoping a single number replaces their own research.
What is the TipRanks Smart Score, and who is it for?
The tipranks smart score is a 1 to 10 rating TipRanks assigns to individual stocks by combining eight measurable inputs into one composite number. Think of it as a weather report built from eight different instruments, not a forecast from one meteorologist with a hunch.
TipRanks says the score involves no human intervention: it's calculated mechanically from data, not adjusted by an editor who likes or dislikes a company. That's a meaningfully different claim than "our analyst thinks this stock is a buy." It's an aggregation engine, and it behaves like one.
Who should care about this: an investor running a watchlist of 30 to 50 names who wants a fast way to see where sentiment, insider behavior and analyst opinion line up (or don't). Someone doing idea generation, not someone looking for a single signal to trade off blind.
Who should skip it: anyone who wants a deep fundamental model, anyone building a quant strategy that needs the underlying weights exposed, and anyone who thinks a high score removes the need to read a 10-K. The tipranks smart score is a screen, not a substitute for process.
Does the Smart Score cover crypto, or just stocks? The Smart Score is built for listed stocks, and several of its inputs (analyst price targets, insider filings, company fundamentals) simply don't exist for crypto. Treat it as a stock tool.
How often does the score update? Because the eight inputs (news sentiment, insider trades, hedge fund filings, analyst rating changes) are all things that change on their own schedule, the composite number is built to move as new data lands rather than sit static for weeks. That's a feature if you're checking a name before earnings season. It's also why a score you saw last month may already be stale today.
What are TipRanks' top five features?
The Smart Score gets the attention, but it's only one of several tools TipRanks puts in front of you.
These five features are where the subscription earns its keep.
🎯 Smart Score: eight signals, one number
A 1 to 10 rating built from analyst ratings, blogger opinions, hedge fund activity, insider transactions, news sentiment, crowd sentiment, fundamentals and technicals.
It turns a long research session into a fast first filter. Treat it as the start of your research, not the end of it.
🏅 Analyst rankings that grade the graders
TipRanks tracks 7,000-plus Wall Street analysts and ranks each one by success rate and average return per rating.
A Strong Buy from a top-ranked analyst and the same call from a bottom-half analyst are not the same signal. TipRanks shows you the difference instead of hiding it behind a job title.
🔍 A stock screener that covers 16 markets
Filter names across the US, Canada, the UK, Germany, Australia, Japan, India, Hong Kong and more.
If you hold anything outside the US, that reach matters. One screen, one workflow, no second tool for your international names.
🏆 Strong Buy and Perfect 10 lists
Ready-made shortlists where analyst consensus and a top Smart Score point the same way.
Use them as a starting watchlist, not a buy list. A shortlist saves you time. It doesn't do your homework.
💼 Smart Portfolio and the expert research layer
Premium adds Smart Portfolio tools for tracking your holdings, daily expert insights and PDF exports. Ultimate adds risk factor analysis, insider hot stocks and fuller expert research.
The mobile apps back it up: 4.8 stars from roughly 19,000 ratings on iOS and 4.7 from 10,326 on Google Play.
Practical takeaway: Start free. Analyst consensus is visible without an account, so you can see whether TipRanks fits your process before you pay for Smart Portfolio and the expert layer.
TipRanks Alpha Score: 78/100
TipRanks earns a 78 out of 100 on the FullStack Alpha scale, built from five pillars scored 20 points each. This is a recommend-with-caveats score: every pillar lands at 14 or higher, and none of them is a rave.
Signal Quality: 15/20. The aggregation itself is reliable and the coverage is wide, but the underlying inputs have a known ceiling. Analyst price targets carry well-documented limited predictive value, and the tipranks smart score inherits that weakness because analyst ratings are one of its eight factors. This is a signal worth checking, not a promise worth trading on.
Transparency: 17/20. This is the standout pillar. TipRanks names all eight factors publicly and ranks its 7,000-plus analysts by measured performance rather than reputation or headline count. The deduction: it does not publish the actual factor weights, so you can see the ingredients but not the recipe.
Price-to-Value: 14/20. The free account is the real value here, since analyst consensus is visible without a subscription. Paid list prices are fair for what's included, but WallStreetZen undercuts TipRanks on price, and TipRanks' web plans only bill yearly.
Usability: 16/20. The interface is clean and widely praised for making dense data readable in seconds.
Community Verdict: 16/20. Sentiment runs positive but not spotless, and the complaints that exist are about billing and support, not the research itself.
How we evaluated: FullStack Alpha did not buy a subscription for this piece. The scoring above comes from reviewing TipRanks' plans, checkout and terms pages, the Smart Score explainer, the screener's backtest page, the App Store and Google Play listings, Trustpilot, and Reddit discussion. See our full How We Test methodology for how every tool on the site gets scored the same way.
What are the eight factors behind the Smart Score?
The tipranks smart score is built from eight named inputs: analyst ratings, blogger opinions, hedge fund activity, insider transactions, news sentiment, crowd (individual investor) sentiment, fundamentals and technicals. That's the full list. TipRanks does not hide what goes in.
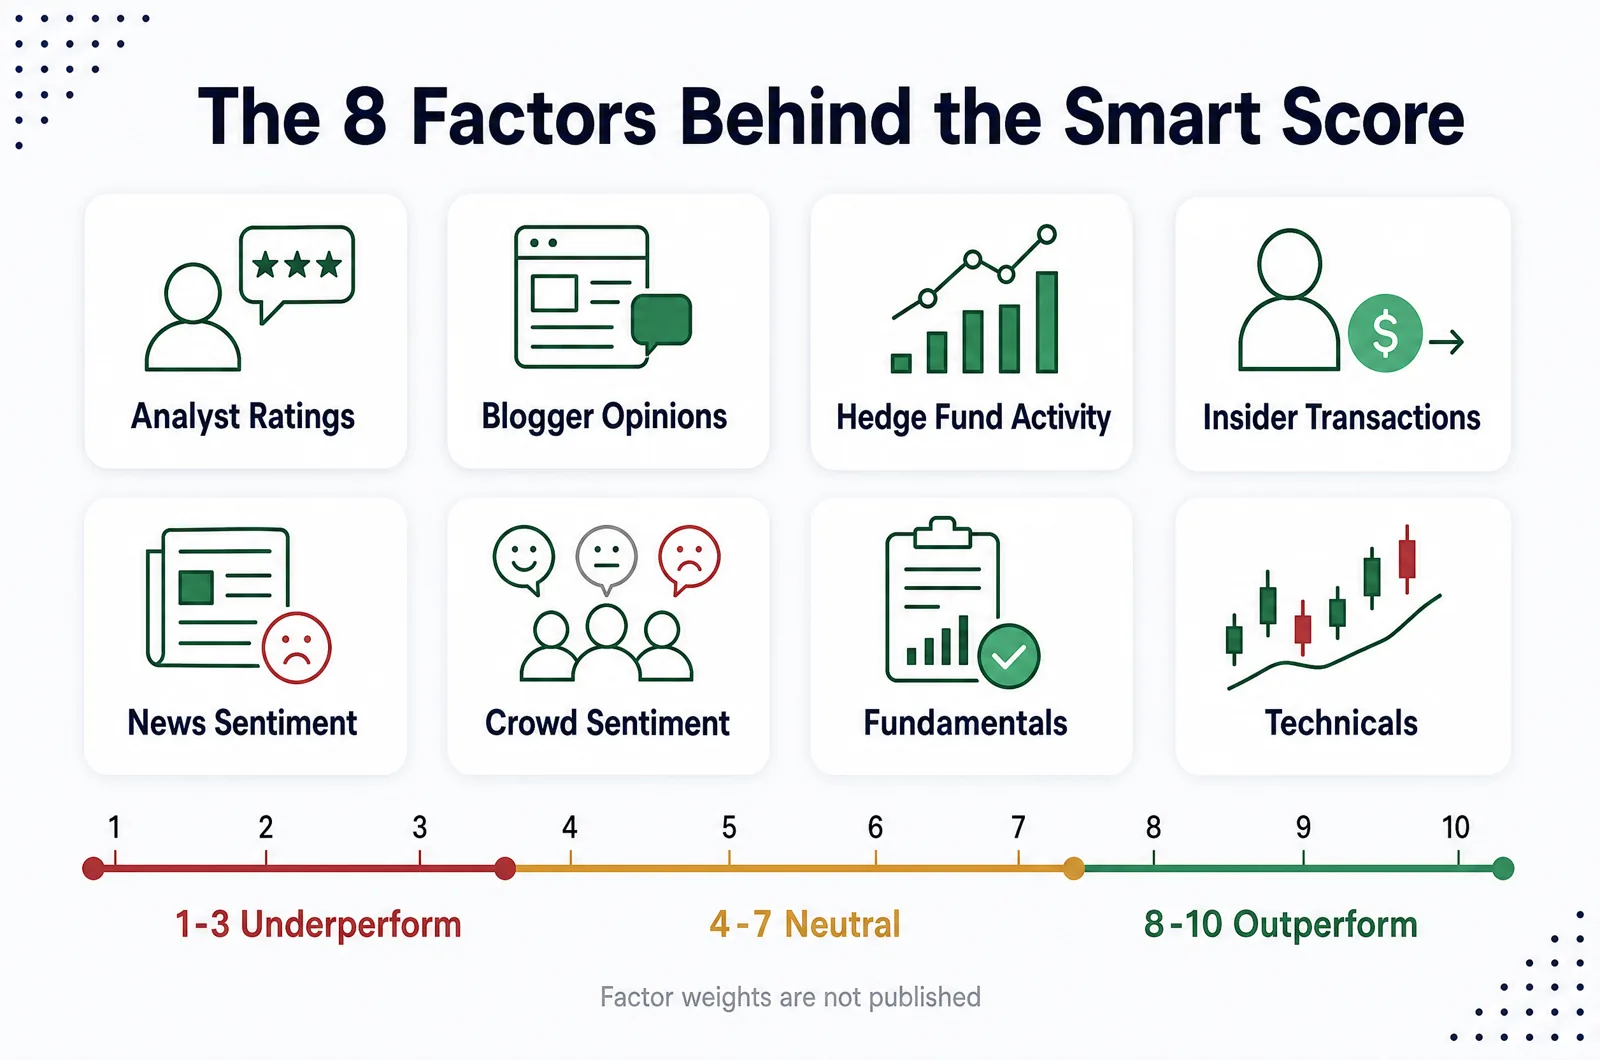
Here's what each one is actually measuring:
- Analyst ratings: the buy, hold and sell calls from TipRanks' tracked pool of over 7,000 Wall Street analysts, whom TipRanks also ranks by measured performance.
- Blogger opinions: sentiment pulled from financial commentary sites TipRanks tracks.
- Hedge fund activity: buying and selling patterns from institutional filings.
- Insider transactions: whether company executives and directors are buying or selling their own stock.
- News sentiment: the tone of recent news coverage on the name.
- Crowd sentiment: what individual investors on TipRanks are doing with their own portfolios and watchlists.
- Fundamentals: financial metrics drawn from the company's reported results.
- Technicals: price and volume behavior, the same kind of price action a chart trader would eyeball.
What TipRanks won't tell you is how much weight each factor carries in the final number. Two stocks could hit the same score of 7 through completely different paths: one might get there on strong fundamentals and weak technicals, another on hot insider buying and neutral analyst coverage. The score doesn't show you which path it took.
The practical takeaway: don't stop at the headline number. Click into the factor breakdown on the stock page before you treat a tipranks smart score as settled. If a 7 is driven by crowd sentiment and news buzz rather than fundamentals or analyst conviction, that's a very different 7 than one built on earnings quality and insider buying.
How is a 10 different from a 7, and what does Outperform actually mean?
A tipranks smart score of 8, 9 or 10 gets the label Outperform. A score of 4 through 7 is Neutral. A score of 1 through 3 is Underperform. Those are the only three tiers that exist.
A 10 means the eight factors, taken together, point as positively as the model allows. It does not mean every single input is bullish; TipRanks does not publish the weights that decide how much each one counts. A 7 sits inside Neutral, meaning the inputs are mixed or moderately positive, not aligned.
What does a tipranks smart score of 7 mean in practice? It means the stock is on the high end of Neutral, close to crossing into Outperform territory, but the eight inputs aren't fully agreeing yet. It's a "watch this" score more than a "buy this" score. Treat a 7 as a nudge to dig into which factors are dragging it down, not as a green light.
Here's the part that trips people up: Outperform is a label describing where the inputs currently sit, not a forecast of what the stock will do next. A 10 today can become a 6 next month if an analyst downgrade lands or an insider starts selling. The score is a snapshot, not a trajectory.
Common mistake: treating "Outperform" as interchangeable with "will outperform." TipRanks names the label after the current mix of data, and that mix updates as fast as the inputs change. A score describes now, and now moves.
Practical takeaway: use the tier as a sorting mechanism across a watchlist, not a prediction about any single name. Pull every stock you follow, sort by score, and use the split between 10s and 4s to decide where to spend your research time first. That's the honest use case.
How good is the Smart Score, really?
The tipranks smart score is a reliable aggregation tool with a real ceiling: it's only as predictive as the inputs feeding it, and one of those inputs, analyst price targets, has a documented history of missing more than it hits. This is a signal, not a promise, and TipRanks itself never claims otherwise.
TipRanks publishes a backtest on its own Smart Score screener page showing that a portfolio of Smart Score 10 US stocks, held since January 2016, returned 451.5% in total, which TipRanks presents as beating the S&P 500 over the same window. That's a real number worth knowing about. It's also worth being blunt about what it isn't.
That backtest is vendor-published, not independently audited, and it's stated before fees, taxes and trading costs. TipRanks' own disclaimer on the same page says backtested performance is not an indicator of future actual results. That disclaimer exists because a backtest is a look backward at one specific historical window, not a guarantee about the next one. Nobody, including TipRanks, is claiming the next eight years will repeat the last eight.
Limitations worth naming directly: the factor weights aren't public, so you can't rebuild or audit the score yourself. Analyst targets, one of the eight inputs, are famously sticky and slow to update, which can lag real news. And because the score blends eight different data types into one number, a stock can carry a misleadingly high or low score if one or two factors are behaving unusually while the rest sit quiet.
Practical takeaway: use the score as a starting filter across a large list of names, then verify the top hits against your own fundamental or technical work before sizing a position. A high score earns you a second look. It doesn't earn you a trade.
Who are the 7,000-plus analysts, and how does TipRanks rank them?
TipRanks tracks over 7,000 Wall Street analysts and scores each one by measured historical performance, not by firm name or headline frequency. That ranking system, separate from but feeding into the tipranks smart score, is the part of the platform that actually earns its Transparency score.
Most financial media treats every analyst call the same way: a Goldman Sachs upgrade gets the same headline weight as a smaller boutique firm's call, regardless of which analyst has actually been right more often. TipRanks instead tracks each individual analyst's calls against real price outcomes over time and ranks them by success rate and average return per rating.
That matters because analyst quality is not uniform. Some analysts at the same firm outperform their peers by a wide margin, and some well-known names have mediocre track records once you actually measure them. TipRanks' analyst ranking exposes that gap, which is a genuinely useful piece of tipranks analyst ratings data most free sources don't show you.
The platform also tracks over 8,000 financial bloggers, 81,000 corporate insiders, roughly 200 hedge fund managers and 450,000 individual investors, feeding the crowd and blogger sentiment factors inside the Smart Score. That's wide coverage, and it's the reason the score can claim to represent more than one type of market participant.
Practical takeaway: before trusting any single analyst upgrade or downgrade, check that analyst's TipRanks ranking. A "Strong Buy" from a top-ranked analyst carries more weight than the same call from someone in the bottom half of the pack, and the site makes that distinction visible instead of hiding it behind a job title.
What do TipRanks Strong Buys and Perfect 10 lists actually tell you?
TipRanks' Strong Buy and Perfect 10 lists surface stocks where analyst consensus and the tipranks smart score both point in the same bullish direction, but they're a filtered view of current sentiment, not a vetted list of winners. Read them as a research starting point, not a shopping list.
A tipranks strong buys designation means recent analyst ratings on the stock add up to a Strong Buy consensus under TipRanks' calculation. A Perfect 10 means the Smart Score itself hit the top of the scale. Seeing both on the same name is the most bullish reading the platform offers.
Here's the caveat that matters: these lists change constantly, because the inputs behind them change constantly. A name on today's Perfect 10 list can drop off within weeks if one analyst downgrades or an insider starts selling. Screenshotting a list and treating it as a permanent buy roster misreads what the tool is doing.
It's also worth separating the list from the backtest. The 451.5% figure discussed earlier applies to TipRanks' own historical backtest of Smart Score 10 stocks since January 2016, a specific study on a specific universe. It is not a live, ongoing guarantee that whatever appears on today's Perfect 10 list will replicate that return. Different stocks, different starting date, different future.
Practical takeaway: use these lists to find candidates worth a closer look, then check the individual factor breakdown behind each name (which factors are actually driving the 10) before you decide anything. A list is a funnel into research, not a finish line.
What does TipRanks cost, and is the free plan enough?
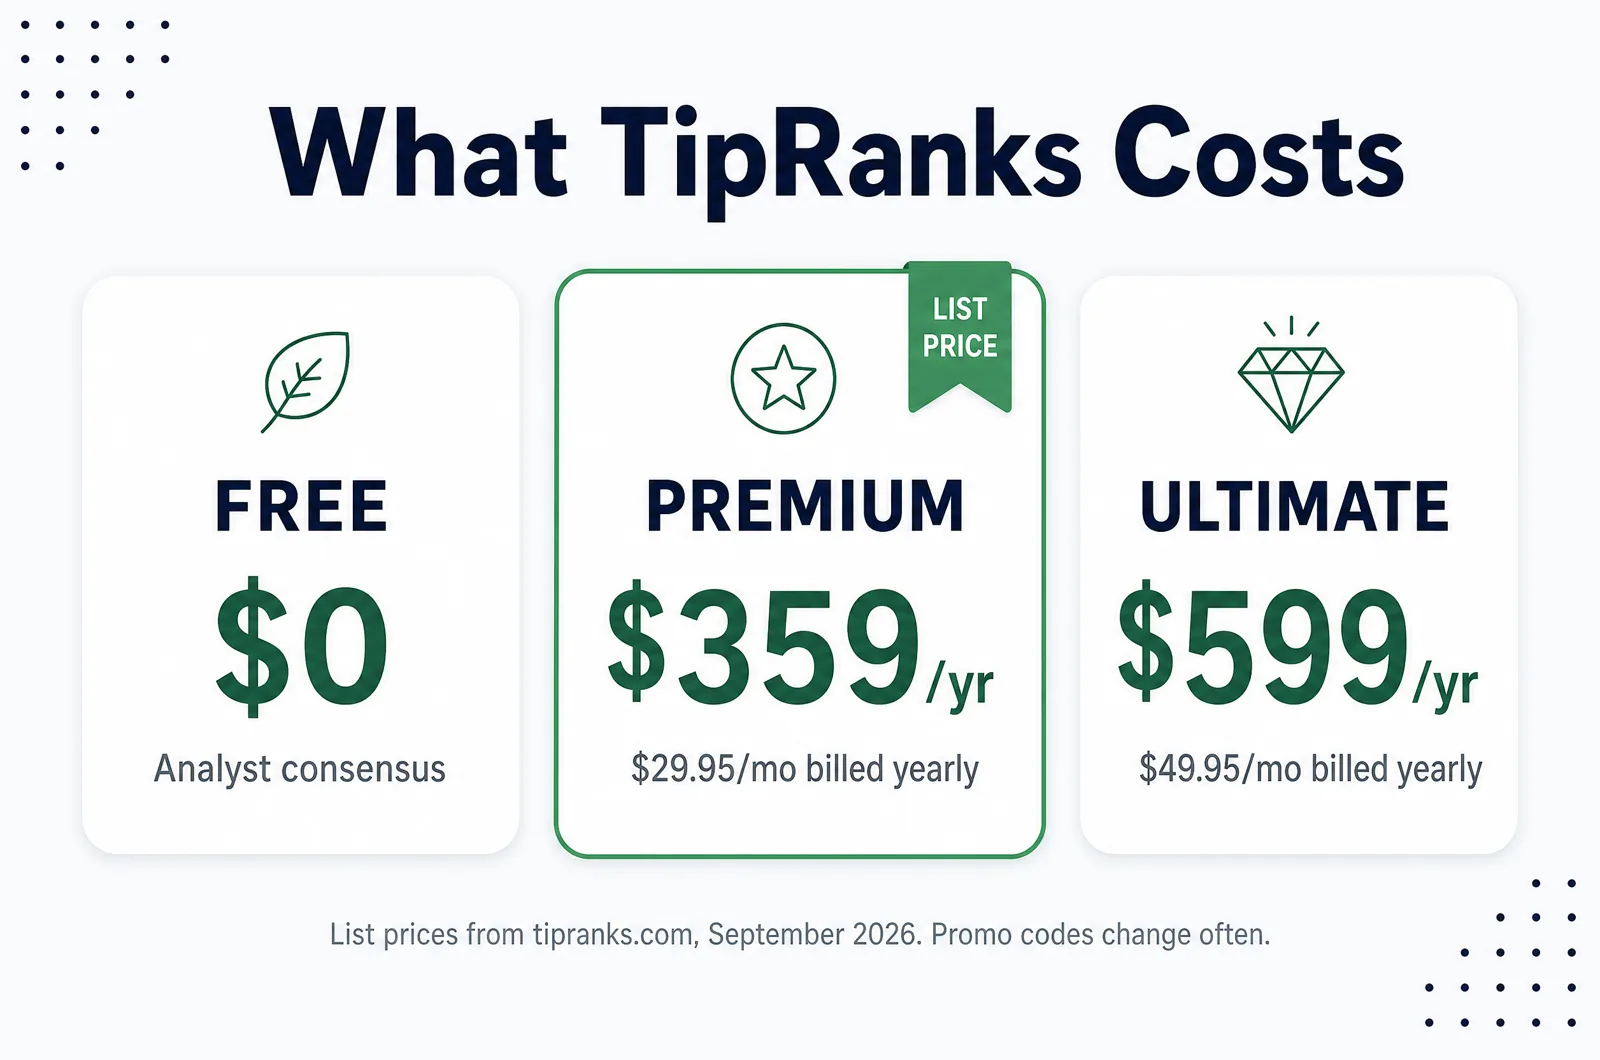
Tipranks pricing starts free for analyst consensus data, with paid plans starting at $359 a year for Premium and $599 a year for Ultimate, billed yearly on the website. That's the honest tipranks cost picture before any discount is applied.
The free account already gives you real value: you can see analyst consensus on any stock page even logged out, and creating a free account adds member benefits on top of that. For an investor who mainly wants consensus ratings on names already on a watchlist, free may be enough.
Paid tiers add the heavier tools. Per TipRanks' plans page, Premium brings Smart Portfolio tools, daily expert insights and PDF exports, and Ultimate adds risk factor analysis, insider hot stocks and fuller expert research. The stock screener covers 16 markets, including the US, Canada, UK, Germany, Australia, Japan, India and Hong Kong. List price is $359 a year ($29.95 a month billed annually) for Premium, and $599 a year ($49.95 a month billed annually) for Ultimate. At the time of writing, a 55% introductory coupon cut those to $161.55 and $269.55 at checkout, though promo sizes shift and smaller codes also circulate, so treat any discounted price as temporary and the list price as the real number to budget against.
One quirk worth flagging: the iOS app charges differently than the website. Inside the App Store, Premium runs $49.99 a month or $349.99 a year, a separate pricing structure from the web checkout.
TipRanks backs web purchases with a 30-day money-back guarantee that extends to renewals and upgrades, usable once per user, per product, per 12 months. It does not cover app-store purchases, and there are no refunds on monthly billing at all. Checkout terms show recurring yearly payment by default, so mark your calendar if you're testing a plan and don't want an automatic renewal. One more detail buried in the terms: usage is capped at 80 page views per day, which won't bother a casual user but could bite someone running heavy daily research sessions.
Practical takeaway: start free, use it for at least two to three weeks against names you already follow, and only upgrade if you find yourself hitting the screener wall or wanting the expanded portfolio tools. Don't pay for Premium to get something the free tier already shows you.
Pros
- A genuinely useful free account, with analyst consensus visible even without signing in
- Tracks over 7,000 Wall Street analysts and ranks them by measured performance, not reputation
- Smart Score names its eight inputs, so you can see what drives the number
- Clean interface that makes dense data readable at a glance
- Screener covers 16 markets, not just US names
- 30-day money-back guarantee on web purchases, including renewals
Cons
- Web plans bill yearly; the only monthly option is inside the iOS app at $49.99 a month
- The guarantee does not cover app-store purchases or monthly plans, and works once per product per 12 months
- Analyst price targets have limited predictive value, and the Smart Score inherits that weakness
- Factor weights are not published, so you cannot fully rebuild the score
- Promo prices change often, so the price you see may not match the price a friend paid
- Criticism in public reviews centers on billing, auto-renewal and support response
- An 80 page views per day cap in the terms can bite heavy users
How does TipRanks compare with Seeking Alpha and WallStreetZen?
Tipranks vs seeking alpha comes down to what each platform builds its flagship number from: TipRanks blends eight sentiment and fundamental inputs into the Smart Score, while Seeking Alpha's Quant Ratings lean on factor-based fundamental and momentum scoring on a 1.0 to 5.0 scale. WallStreetZen's Zen Ratings claims to analyze 115 factors, a much wider input set on paper.
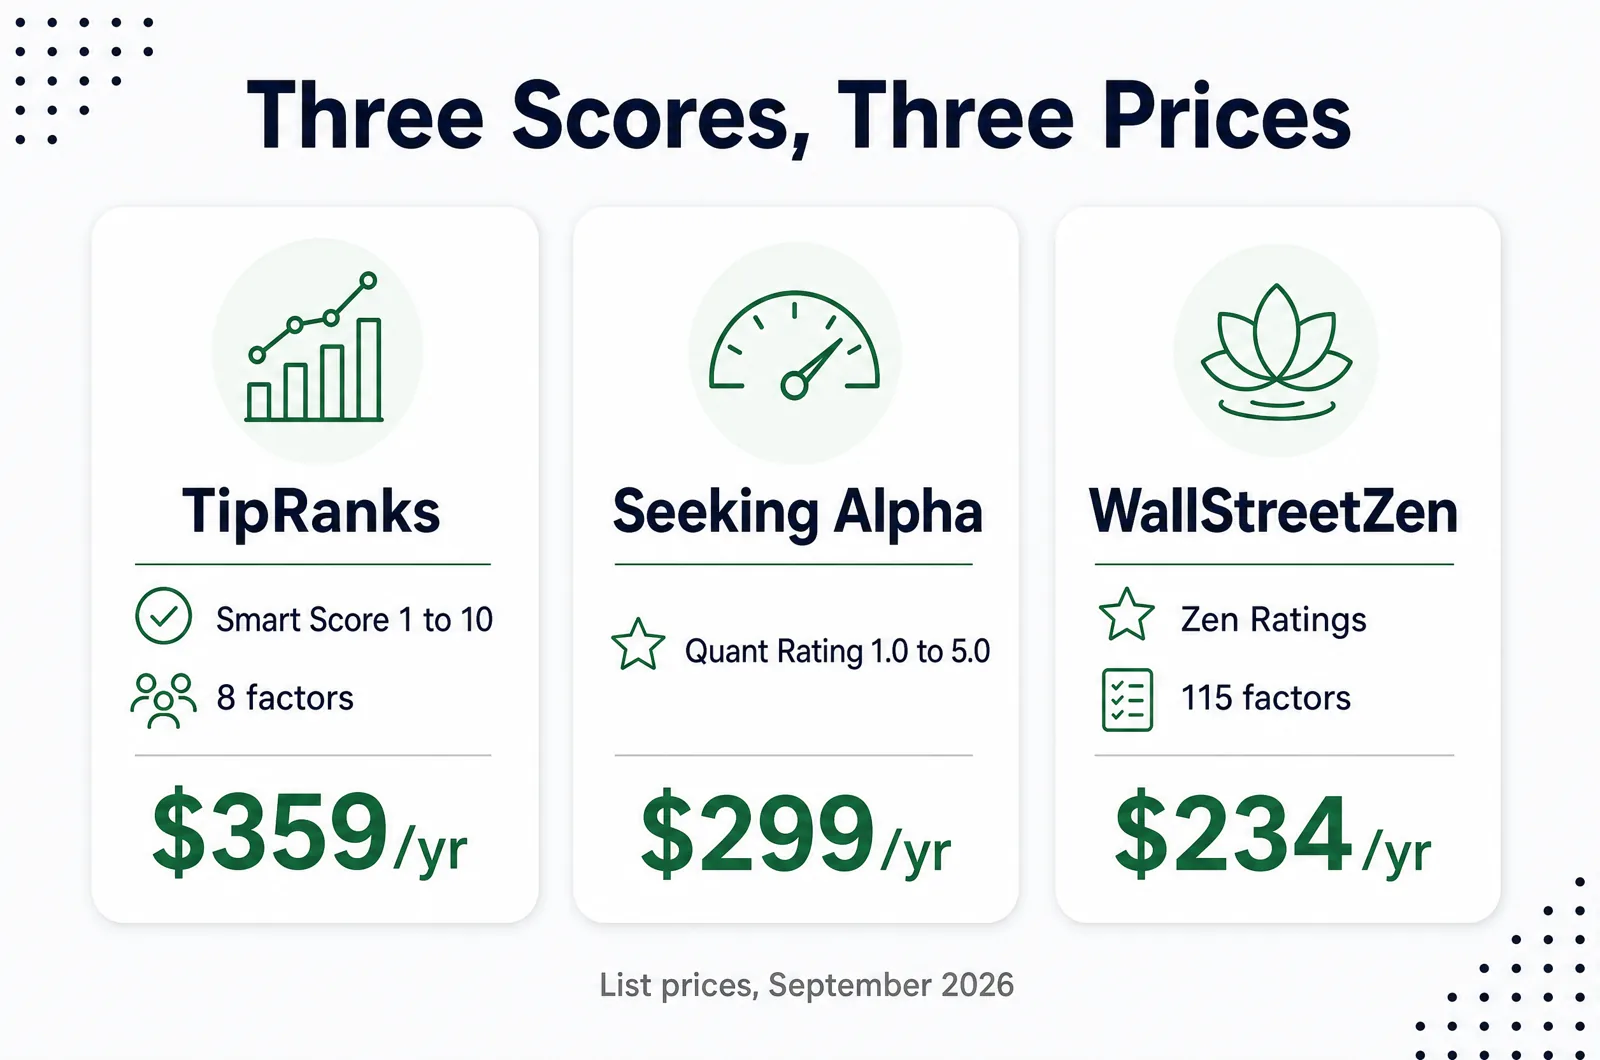
None of the three is objectively "more accurate," because none of them publishes an independently audited track record against the others. What differs is price, billing structure and how much of the model each vendor shows you. TipRanks wins on naming its inputs clearly and on analyst-track-record transparency. WallStreetZen wins on price. Seeking Alpha's strength sits more in its community and article layer than in Quant Ratings alone, something covered in more depth in our Seeking Alpha Premium review.
If price is the deciding factor, WallStreetZen's Zen Premium at $234 a year list undercuts both TipRanks and Seeking Alpha. If breadth of analyst coverage and a genuinely useful free tier matter more, TipRanks holds an edge. Our full TipRanks scorecard breaks down the platform beyond the Smart Score alone, including its portfolio tracking and news tools.
| Platform | Flagship metric | Built from | Paid list price / year | Billing options | Refund guarantee |
|---|---|---|---|---|---|
| TipRanks | Smart Score (1 to 10) | 8 factors: analyst, blogger, hedge fund, insider, news, crowd, fundamentals, technicals | $359 (Premium), $599 (Ultimate) | Yearly on web; monthly only via iOS app ($49.99/mo) | 30-day, web purchases only |
| Seeking Alpha | Quant Ratings (1.0 to 5.0) | Not verified | $299 (Premium) | Not verified | Not verified |
| WallStreetZen | Zen Ratings | 115 factors (vendor-claimed) | $234 (Zen Premium) | Monthly, billed yearly ($19.50/mo) | Not verified |
Practical takeaway: pick TipRanks if analyst track records and a wide free tier matter to you. Pick WallStreetZen if price is the deciding line. Pick Seeking Alpha if the article and community layer around the rating matters as much as the number itself.
How easy is TipRanks to use day to day?
TipRanks' interface is one of the cleanest in this category, and that's why Usability scores 16 out of 20 on the Alpha Score. Dense data (eight factors, multiple analyst calls, insider trades) reads clearly on a single stock page instead of burying you in tabs.
TipRanks stock pages pull the tipranks smart score, analyst consensus, insider activity and news sentiment into one place, so you are not hunting through tabs. That first-week experience matters more than people admit: a tool that takes three weeks to learn loses users before it proves its value, and TipRanks avoids that trap.
Both iOS and Android apps are available, with strong app-store ratings backing that up (more on that in the next section). One small housekeeping note: TipRanks' own FAQ page is out of date and still says an Android app "will be developed in the future," even though it's live. That's a documentation gap, not a product gap, but it's worth knowing before you go looking for an app that already exists.
The stock screener covers 16 markets including the US, Canada, UK, Germany, Australia, Japan, India and Hong Kong, and lets you filter by Smart Score alongside more conventional fundamental and technical filters. If you're building a systematic watchlist process, pairing a Smart Score filter with a broader screener like the ones covered in our best AI stock screeners guide gives you a cleaner funnel than eyeballing individual stock pages one at a time.
Practical takeaway: if you're new to the platform, spend your first session on a handful of stocks you already know well. Watching how the Smart Score and factor breakdown react on names you understand teaches you the tool faster than reading documentation.
What do real users say about TipRanks?
Public sentiment on TipRanks runs positive but not spotless, and the complaints that exist cluster around billing and support, not the quality of the research itself. That split matters when you're deciding whether the tipranks smart score is worth paying for.
Trustpilot rates TipRanks 4.2 out of 5 ("Great") across 1,581 reviews, with 81% five-star. Worth flagging: only 39 of those reviews were posted in the last 12 months, and Trustpilot shows no recent pattern of TipRanks actively soliciting reviews, which suggests the current 4.2 rating leans on an older review base more than fresh feedback. TipRanks did respond to 72% of negative reviews, which is a reasonable support-engagement number even if the underlying complaints skew toward billing and auto-renewal confusion.
App store numbers tell a stronger story: iOS sits at 4.8 stars from roughly 19,000 ratings, and Google Play holds 4.7 from 10,326 ratings. Both numbers point to a mobile experience that's landing well with the people actually using it day to day.
Tipranks reddit threads run mixed to positive. The praise centers on idea generation, the analyst ranking system, and the free tier's usefulness for a quick sentiment check. The skepticism is the standard, reasonable kind: some investors question paying for a tool built partly on analyst price targets, given the well-known limits of those targets as a predictive input. That's a fair critique, and it's the same one this article makes about Signal Quality.
Practical takeaway: read the Trustpilot complaints before you buy, specifically the ones about auto-renewal and refund friction. If billing clarity matters to you as much as the research quality, know the guarantee terms cold before checkout, not after a surprise renewal charge.
How should you use the Smart Score without getting burned?
Use the tipranks smart score as a filter to narrow a list, never as the final word on a trade. Here's a five-step process that keeps the tool useful without letting it make decisions for you.

- Screen with the score, not on the score alone. Pull your watchlist, sort by Smart Score, and flag anything Outperform (8 to 10). That's your starting list, not your buy list.
- Open the factor breakdown on every flagged name. Check which of the eight inputs is actually driving the number. A score built on strong fundamentals and analyst conviction is a different story than one built on news buzz and crowd sentiment alone.
- Cross-check the top-ranked analyst calls, not just the consensus. Use TipRanks' analyst performance ranking to see whether the bullish calls behind a high score are coming from historically strong analysts or from the bottom of the pack.
- Verify against your own process. Whatever your system already runs on, whether that's fundamental screens, price action and support and resistance, or a basic earnings-quality check, run the flagged names through it before sizing anything.
- Size the position like you would any other trade. A high Smart Score is not a reason to skip position sizing or a stop loss. Treat it as one input among several, same as you'd treat a single technical indicator.
Common mistake to avoid: chasing a name purely because it just flipped to a Perfect 10. Scores move because inputs move, and a score that just spiked can be as much about a short-term sentiment swing as it is about a durable change in the business.
Can you rely solely on the Smart Score for stock picks? No. It's built from public, backward-looking data and it says so itself through its own backtest disclaimer. Treat it as one signal in a process, not the whole process. Signal over noise still requires a signal you've stress-tested yourself, not just a number on a page.
What are the best alternatives to TipRanks?
The strongest alternatives to TipRanks split by what you actually need: Seeking Alpha for article depth and community, WallStreetZen for price, and Danelfin for a transparent AI-scoring model built on a published factor set. None of them replaces the need to do your own verification.
- Seeking Alpha Premium ($299/year list): stronger for long-form investment theses and community discussion, with Quant Ratings as its own version of a composite score. Read the full breakdown in our Seeking Alpha Premium review.
- WallStreetZen Zen Premium ($234/year list): the cheapest of the three, with a wider claimed factor count (115) behind Zen Ratings. Worth a look if price-to-value is your top priority.
- Danelfin: a different model entirely, built on an AI scoring system with a published factor structure. Our Danelfin review covers how its transparency compares to TipRanks' approach.
- Motley Fool Stock Advisor: for investors who want fewer names and more conviction-driven picks instead of a broad scored universe. See our Motley Fool Stock Advisor review for the honest read on pricing and performance claims.
- Simply Wall St: a visually different approach to fundamental scoring, worth comparing if you want a snapshot-style summary rather than a numeric score. Covered in our Simply Wall St review.
Practical takeaway: don't assume the highest-rated tool on any list is automatically the right one for you. Match the tool to the job. If you want a fast sentiment check across a wide watchlist, TipRanks earns its spot. If you want fewer, higher-conviction picks with more narrative behind them, look at Motley Fool or Seeking Alpha instead.
Final Verdict
The tipranks smart score earns its 78 out of 100: a transparent factor list, wide analyst coverage and a genuinely useful free tier, weighed against yearly-only web billing and the honest limits of analyst-target-based signals. Recommend, with the caveats stated plainly above.
Yes, if: you want fast idea generation and sentiment checks across a large watchlist, you value seeing which analysts are actually good at their job, and you're disciplined enough to treat an 8 to 10 as a research flag rather than a trade ticket.
No, if: you're looking for a deep fundamental modeling tool, you want to see the exact math behind every number, or you're hoping a single score can replace the process work of reading filings, checking price action, and managing your own risk-reward on every position.
TipRanks earned its score. It still isn't the only option worth looking at. The FullStack Alpha directory catalogues 200+ AI stock tools by category and price. See what else is out there at aistockpickerapps.com.
FullStack Alpha may earn a commission if you buy through links on this page, at no extra cost to you.
We test the tools. You get the verdict.
One email a week. What we tested, what scored, and what we'd skip. Written for traders, not for clicks.
Frequently asked
Topics in this teardown
Our verdict on TipRanks
TipRanks does one thing almost nobody else does: it scores the people making the calls, not just the calls.